The annual financial statements of Hunter Ltd for the financial years ended 31 December 2018 and 2019 are presented below. Hunter Limited Statement of profit or loss and other comprehensive income for the vear ended 31 December 2019 2019 2018 R R Revenue from sales 540 000 480 000 Cost of Sales (360 000) (318 000) Opening Inventory 42 000 30 000 Purchases 390 000 330 000 Goods available for sale 432 000 360 000 Closing Inventory (72 000) (42 000) Gross Profit 180 000 162 000 Selling and distribution expenses (37 000) (36 000) Administration expenses (72 000) (54 000) Interest on loan (3 000) (3 000) Profit before taxation 68 000 69 000 Taxation paid (20 400) (20 700) Profit for the year 47 600 48 300 Other comprehensive income Nil Nil Total comprehensive income for the year 47 600 48 300 Hunter Limited Statement of changes in equity for the year ended 31 December 2019 Ordinary Retained Preference Total Share capital earnings share capital Balance at 1 January 2018 120 000 12 000 60 000 192 000 Total comprehensive income 48 300 48 300 Preference dividends paid (6 000) (6 000) Ordinary dividends declared (24 000) (24 000) Balance at 31 December 2018 120 000 30 300 60 000 210 300 Total comprehensive income 47 600 47 600
The annual financial statements of Hunter Ltd for the financial years ended 31 December 2018 and 2019 are presented below. Hunter Limited Statement of profit or loss and other comprehensive income for the vear ended 31 December 2019 2019 2018 R R Revenue from sales 540 000 480 000 Cost of Sales (360 000) (318 000) Opening Inventory 42 000 30 000 Purchases 390 000 330 000 Goods available for sale 432 000 360 000 Closing Inventory (72 000) (42 000) Gross Profit 180 000 162 000 Selling and distribution expenses (37 000) (36 000) Administration expenses (72 000) (54 000) Interest on loan (3 000) (3 000) Profit before taxation 68 000 69 000 Taxation paid (20 400) (20 700) Profit for the year 47 600 48 300 Other comprehensive income Nil Nil Total comprehensive income for the year 47 600 48 300 Hunter Limited Statement of changes in equity for the year ended 31 December 2019 Ordinary Retained Preference Total Share capital earnings share capital Balance at 1 January 2018 120 000 12 000 60 000 192 000 Total comprehensive income 48 300 48 300 Preference dividends paid (6 000) (6 000) Ordinary dividends declared (24 000) (24 000) Balance at 31 December 2018 120 000 30 300 60 000 210 300 Total comprehensive income 47 600 47 600

Intermediate Accounting: Reporting And Analysis
3rd Edition
ISBN:9781337788281
Author:James M. Wahlen, Jefferson P. Jones, Donald Pagach
Publisher:James M. Wahlen, Jefferson P. Jones, Donald Pagach
Chapter5: The Income Statement And The Statement Of Cash Flows
Section: Chapter Questions
Problem 8E: Cost of Goods Sold, Income Statement. and Statement of Comprehensive Income Gaskin Company derives...

Related questions
Question
Evaluate the company's perfomance and position using financial ratio analysis
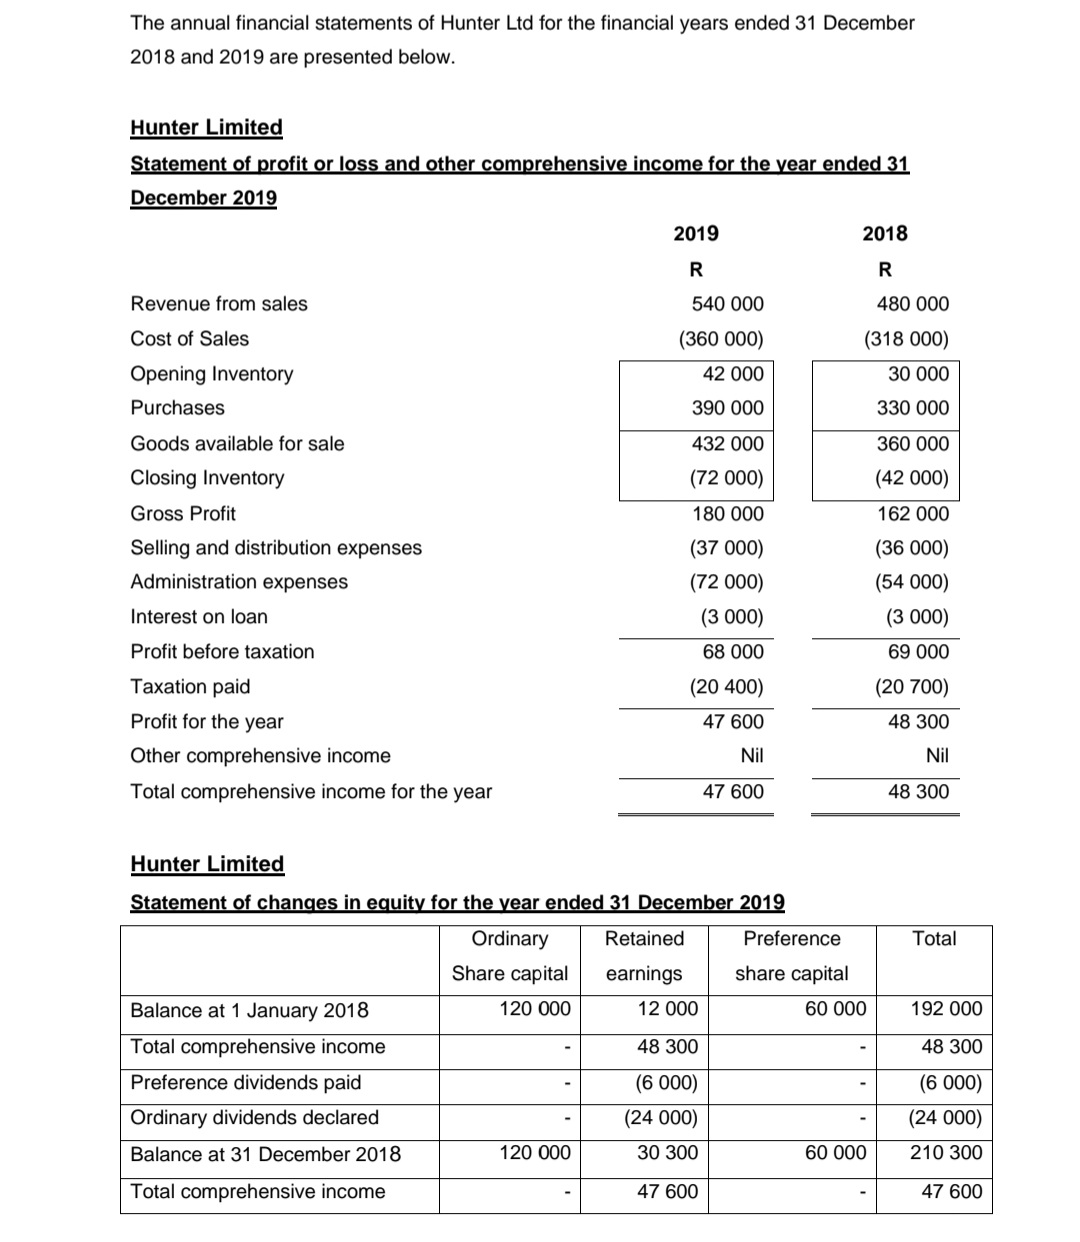
Transcribed Image Text:The annual financial statements of Hunter Ltd for the financial years ended 31 December
2018 and 2019 are presented below.
Hunter Limited
Statement of profit or loss and other comprehensive income for the vear ended 31
December 2019
2019
2018
R
R
Revenue from sales
540 000
480 000
Cost of Sales
(360 000)
(318 000)
Opening Inventory
42 000
30 000
Purchases
390 000
330 000
Goods available for sale
432 000
360 000
Closing Inventory
(72 000)
(42 000)
Gross Profit
180 000
162 000
Selling and distribution expenses
(37 000)
(36 000)
Administration expenses
(72 000)
(54 000)
Interest on loan
(3 000)
(3 000)
Profit before taxation
68 000
69 000
Taxation paid
(20 400)
(20 700)
Profit for the year
47 600
48 300
Other comprehensive income
Nil
Nil
Total comprehensive income for the year
47 600
48 300
Hunter Limited
Statement of changes in equity for the year ended 31 December 2019
Ordinary
Retained
Preference
Total
Share capital
earnings
share capital
Balance at 1 January 2018
120 000
12 000
60 000
192 000
Total comprehensive income
48 300
48 300
Preference dividends paid
(6 000)
(6 000)
Ordinary dividends declared
(24 000)
(24 000)
Balance at 31 December 2018
120 000
30 300
60 000
210 300
Total comprehensive income
47 600
47 600
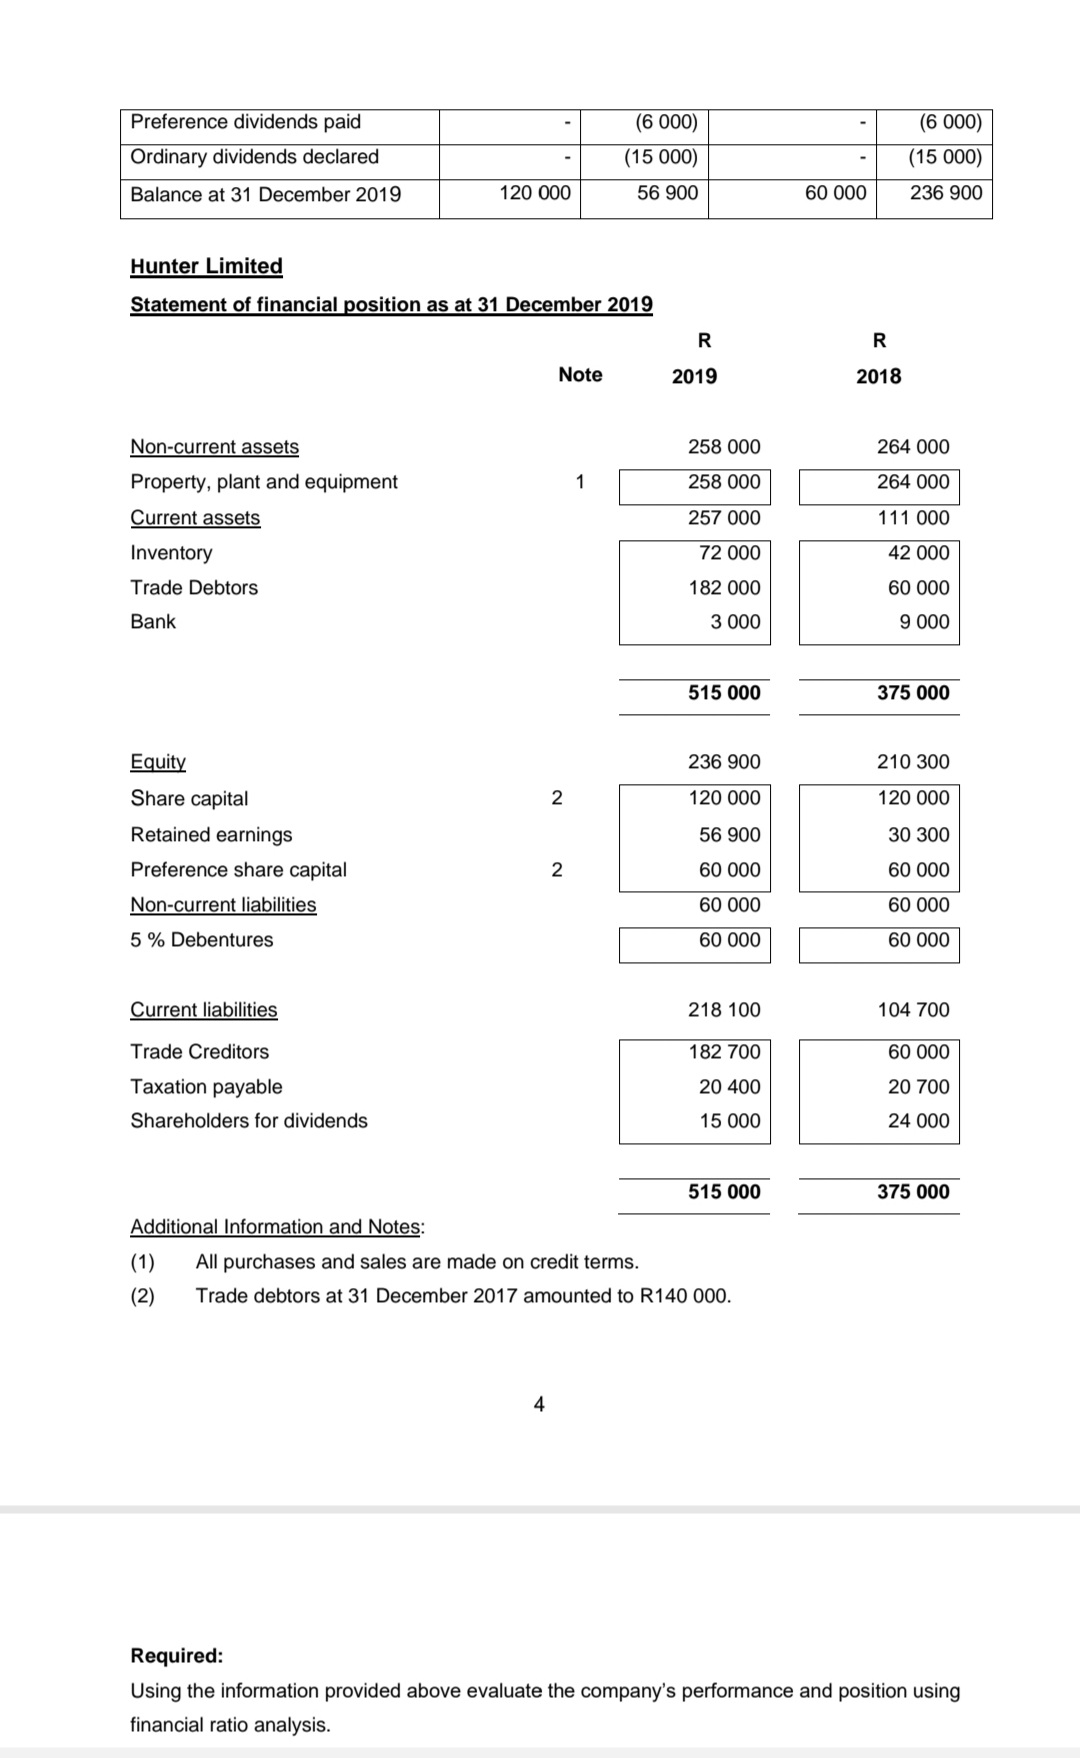
Transcribed Image Text:Preference dividends paid
(6 000)
(6 000)
Ordinary dividends declared
(15 000)
(15 000)
Balance at 31 December 2019
120 000
56 900
60 000
236 900
Hunter Limited
Statement of financial position as at 31 December 2019
R
Note
2019
2018
Non-current assets
258 000
264 000
Property, plant and equipment
1
258 000
264 000
Current assets
257 000
111 000
Inventory
72 000
42 000
Trade Debtors
182 000
60 000
Bank
3 000
9 000
515 000
375 000
Equity
236 900
210 300
Share capital
2
120 000
120 000
Retained earnings
56 900
30 300
Preference share capital
2
60 000
60 000
Non-current liabilities
60 000
60 000
5 % Debentures
60 000
60 000
Current liabilities
218 100
104 700
Trade Creditors
182 700
60 000
Taxation payable
20 400
20 700
Shareholders for dividends
15 000
24 000
515 000
375 000
Additional Information and Notes:
(1)
All purchases and sales are made on credit terms.
(2)
Trade debtors at 31 December 2017 amounted to R140 000.
4
Required:
Using the information provided above evaluate the company's performance and position using
financial ratio analysis.
Expert Solution
This question has been solved!
Explore an expertly crafted, step-by-step solution for a thorough understanding of key concepts.

Step by step
Solved in 3 steps with 2 images

Knowledge Booster


Learn more about
Need a deep-dive on the concept behind this application? Look no further. Learn more about this topic, accounting and related others by exploring similar questions and additional content below.Recommended textbooks for you
Intermediate Accounting: Reporting And Analysis
Accounting
ISBN:
9781337788281
Author:
James M. Wahlen, Jefferson P. Jones, Donald Pagach
Publisher:
Cengage Learning

Financial Accounting
Accounting
ISBN:
9781337272124
Author:
Carl Warren, James M. Reeve, Jonathan Duchac
Publisher:
Cengage Learning

Survey of Accounting (Accounting I)
Accounting
ISBN:
9781305961883
Author:
Carl Warren
Publisher:
Cengage Learning
Intermediate Accounting: Reporting And Analysis
Accounting
ISBN:
9781337788281
Author:
James M. Wahlen, Jefferson P. Jones, Donald Pagach
Publisher:
Cengage Learning
Financial Accounting
Accounting
ISBN:
9781337272124
Author:
Carl Warren, James M. Reeve, Jonathan Duchac
Publisher:
Cengage Learning
Survey of Accounting (Accounting I)
Accounting
ISBN:
9781305961883
Author:
Carl Warren
Publisher:
Cengage Learning

Cornerstones of Financial Accounting
Accounting
ISBN:
9781337690881
Author:
Jay Rich, Jeff Jones
Publisher:
Cengage Learning