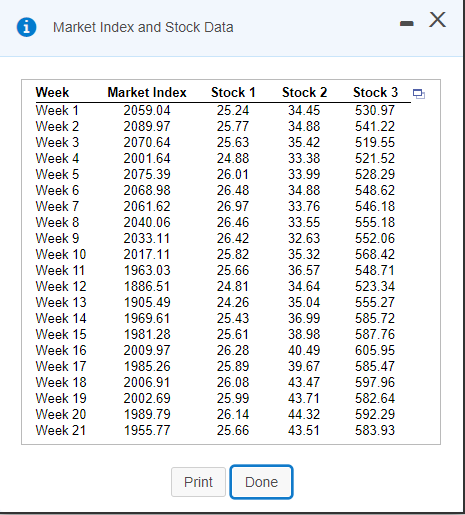
The volatility of a stock is often measured by its beta value. The beta value of a stock can be estimated by developing a simple linear regression model, using the percentage weekly change in the stock as the dependent variable and the percentage weekly change in a market index as the independent variable. The least-squares regression estimate of the slopeb1 is the estimate of the beta value. A stock with a beta value of 1.0 tends to move the same as the overall market. A stock with a beta value of 1.5 tends to move 50% more than the overall market, and a stock with a beta value of 0.6 tends to move only 60% as much as the overall market. Stocks with negative beta values tend to move in the opposite direction of the overall market. The accompanying data contain the weekly closing values for a particular market index and the weekly closing stock prices for three companies. Date given in image. A) Estimate the market model for Stock 1. (Hint: Use the percentage change in the market index as the independent variable and the percentage change in Stock 1's price as the dependent variable.) B) Estimate the market model for Stock 2 C) Estimate the market model for Stock 3


Correlation
Correlation defines a relationship between two independent variables. It tells the degree to which variables move in relation to each other. When two sets of data are related to each other, there is a correlation between them.
Linear Correlation
A correlation is used to determine the relationships between numerical and categorical variables. In other words, it is an indicator of how things are connected to one another. The correlation analysis is the study of how variables are related.
Regression Analysis
Regression analysis is a statistical method in which it estimates the relationship between a dependent variable and one or more independent variable. In simple terms dependent variable is called as outcome variable and independent variable is called as predictors. Regression analysis is one of the methods to find the trends in data. The independent variable used in Regression analysis is named Predictor variable. It offers data of an associated dependent variable regarding a particular outcome.
is the estimate of the beta value. A stock with a beta value of 1.0 tends to move the same as the overall market. A stock with a beta value of 1.5 tends to move 50% more than the overall market, and a stock with a beta value of 0.6 tends to move only 60% as much as the overall market. Stocks with negative beta values tend to move in the opposite direction of the overall market. The accompanying data contain the weekly closing values for a particular market index and the weekly closing stock prices for three companies.


Trending now
This is a popular solution!

Step by step
Solved in 3 steps


