Managerial Accounting (5th Edition)
5th Edition
ISBN: 9780134067254
Author: Braun
Publisher: PEARSON
expand_more
expand_more
format_list_bulleted
Concept explainers
Videos
Textbook Question
Chapter 10, Problem 10.31BE
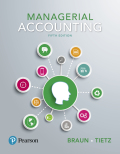
Complete and analyze a performance report (Learning Objective 2)
One subunit of Contest Sports Manufacturing Company had the following financial results last month:
10.3-21 Full Alternative Text
Requirements
- 1. Complete the performance evaluation report for this subunit (round to four decimals).
- 2. Based on the data presented, what type of responsibility center is this subunit?
- 3. Which items should be investigated if part of management’s decision criteria is to investigate all variances exceeding $2,900 or 13%?
- 4. Should only unfavorable variances be investigated? Explain.
Expert Solution & Answer
Want to see the full answer?
Check out a sample textbook solution
Students have asked these similar questions
Assume that Whee, Cheatham, and Howe is an auditing firm that has found that its summer interns are subject to a 90 percent learning curve for one of its important tasks, proofreading financial statements. For one of its interns, Kim Down, the firm has started to analyze the relation between time and financial statement proofreading.
Financial StatementsProofread (X)
Time Required to Proofreadthe Xth Financial Statement
1
2.0 hours
2
1.8 hours
4
?
8
?
16
?
Required:
a. Compute the time required to proofread 4, 8, and 16 financial statements.
Using responsibility reports to evaluate cost, revenue, and profit centers
The accountant for a subunit of Speed Sports Company went on vacation before completing the subunit’s monthly responsibility report. This is as far as she got:
Requirements
Complete the responsibility report for this subunit.
Based on the data presented, what type of responsibility center is this Subunit.
Which items should be investigated if part of management’s decision criteria is to investigate all variances exceeding $12,000?
Integrating decentralization and performance evaluation systems
One subunit of Track Sports Company had the following financial results last month:
Requirements
Complete the performance evaluation report for this subunit (round to two decimal places).
Based on the data presented and your knowledge of the company, what type of responsibility center is this subunit?
Which items should be investigated if part of management’s decision criteria is to investigate all variances equal to or exceeding $8,000 arm’ exceeding 10% (both criteria must be met)?
Should only unfavorable variances be investigated? Explain.
Is it possible that the variances are due to a higher-than-expected sales volume? Explain.
Will management place equal weight on each of the variances exceeding $8,000? Explain.
Which balanced scorecard perspective is being addressed through this performance report? In your opinion, is this performance report a lead or a lag indicator? Explain.
List one key performance indicator for…
Chapter 10 Solutions
Managerial Accounting (5th Edition)
Ch. 10 - (Learning Objective 1) Companies often...Ch. 10 - (Learning Objective 1) Which of the following is...Ch. 10 - (Learning Objective 1) In terms of responsibility...Ch. 10 - (Learning Objective 2) Which of the following is...Ch. 10 - (Learning Objective 2) A segment margin is the...Ch. 10 - Prob. 6QCCh. 10 - Prob. 7QCCh. 10 - Prob. 8QCCh. 10 - Prob. 9QCCh. 10 - Prob. 10QC
Ch. 10 - Identify and understand responsibility centers...Ch. 10 - Identify types of responsibility centers (Learning...Ch. 10 - Identify centralized and decentralized...Ch. 10 - Prob. 10.4SECh. 10 - Prob. 10.5SECh. 10 - Prob. 10.6SECh. 10 - Calculate ROI (Learning Objective 3) Refer to Epic...Ch. 10 - Prob. 10.8SECh. 10 - Prob. 10.9SECh. 10 - Prob. 10.10SECh. 10 - Prob. 10.11SECh. 10 - Interpret a performance report (Learning Objective...Ch. 10 - Prob. 10.13SECh. 10 - Classify KPIs by balanced scorecard perspective...Ch. 10 - Use vocabulary terms (Learning Objectives 1, 2, 3,...Ch. 10 - Prob. 10.16SECh. 10 - Identify type of responsibility center (Learning...Ch. 10 - Complete and analyze a performance report...Ch. 10 - Prepare a segment margin performance report...Ch. 10 - Compute and interpret the expanded ROI equation...Ch. 10 - Prob. 10.21AECh. 10 - Prob. 10.22AECh. 10 - Comparison of ROI and residual income (Learning...Ch. 10 - Prob. 10.24AECh. 10 - Comprehensive flexible budget problem (Learning...Ch. 10 - Prepare a flexible budget performance report...Ch. 10 - Work backward to find missing values (Learning...Ch. 10 - Construct a balanced scorecard (Learning Objective...Ch. 10 - Sustainability and the balanced scorecard...Ch. 10 - Identify type of responsibility center (Learning...Ch. 10 - Complete and analyze a performance report...Ch. 10 - Prob. 10.32BECh. 10 - Prob. 10.33BECh. 10 - Prob. 10.34BECh. 10 - Prob. 10.35BECh. 10 - Prob. 10.36BECh. 10 - Prob. 10.37BECh. 10 - Prob. 10.38BECh. 10 - Prob. 10.39BECh. 10 - Prob. 10.40BECh. 10 - Prob. 10.41BECh. 10 - Sustainability and the balanced scorecard...Ch. 10 - Prepare a budget with different volumes for...Ch. 10 - Prepare and interpret a performance report...Ch. 10 - Prob. 10.45APCh. 10 - Prob. 10.46APCh. 10 - Prob. 10.47APCh. 10 - Evaluate subunit performance (Learning Objectives...Ch. 10 - Prob. 10.49BPCh. 10 - Prob. 10.50BPCh. 10 - Evaluate divisional performance (Learning...Ch. 10 - Prob. 10.52BPCh. 10 - Determine transfer price at a manufacturer under...Ch. 10 - Evaluate subunit performance (Learning Objectives...Ch. 10 - Prob. 10.55SC
Knowledge Booster


Learn more about
Need a deep-dive on the concept behind this application? Look no further. Learn more about this topic, accounting and related others by exploring similar questions and additional content below.Similar questions
- Bradford Company, a manufacturer of small tools, implemented lean manufacturing at the end of 20x1. The companys goal for the year was to increase the ROS to 40 percent of sales. A value-stream team was established and began to work on lean improvements. During the year, the team was able to achieve significant results on several fronts. The Box Scorecard below reflects the performance measures at the beginning of the year, midyear, and end of year. Although the team members were pleased with their progress, they were disappointed in the financial results. They were still far from the targeted ROS of 40 percent. They were also puzzled as to why the improvements made did not translate into significantly improved financial performance. Required: 1. From the scorecard, what was the focus of the value-stream team for the first six months? The second six months? What are the implications of these changes? 2. Using information from the scorecard, offer an explanation for why the financial results were not as good as expected. 3. Suppose that on December 31, 20x2, a potential customer offered to purchase an order of goods that would increase weekly revenues in January by 100,000 and material cost by 30,000. Using the old standard cost system, the projected conversion cost of the order would be 60,000. Would you recommend that the order be accepted or rejected? Explain.arrow_forwardMerkley Company, a manufacturer of machine parts, implemented lean manufacturing at the end of 20X1. Three value streams were established: one for new product development and two order fulfillment value streams. One of the value streams set a goal to increase its ROS to 45% of sales by the end of the year. During the year, the value stream made significant improvements in several areas. The Box Scorecard below was prepared, with performance measures for the beginning of the year, midyear, and end of year. Although the members of the value stream were pleased with their progress, they were disappointed in the financial results. They were still far from the targeted ROS of 45%. They were also puzzled as to why the improvements made did not translate into significantly improved financial performance. Required: 1. From the scorecard, what was the focus of the value-stream team for the first 6 months? The second 6 months? What are the implications of these changes? 2. Using information from the scorecard, offer an explanation for why the financial results were not as good as expected.arrow_forwardAt the end of 20x1, Mejorar Company implemented a low-cost strategy to improve its competitive position. Its objective was to become the low-cost producer in its industry. A Balanced Scorecard was developed to guide the company toward this objective. To lower costs, Mejorar undertook a number of improvement activities such as JIT production, total quality management, and activity-based management. Now, after two years of operation, the president of Mejorar wants some assessment of the achievements. To help provide this assessment, the following information on one product has been gathered: Required: 1. Compute the following measures for 20x1 and 20x3: a. Actual velocity and cycle time b. Percentage of total revenue from new customers (assume one unit per customer) c. Percentage of very satisfied customers (assume each customer purchases one unit) d. Market share e. Percentage change in actual product cost (for 20x3 only) f. Percentage change in days of inventory (for 20x3 only) g. Defective units as a percentage of total units produced h. Total hours of training i. Suggestions per production worker j. Total revenue k. Number of new customers 2. For the measures listed in Requirement 1, list likely strategic objectives, classified according to the four Balance Scorecard perspectives. Assume there is one measure per objective.arrow_forward
- Hyperflash Inc. has a balanced scorecard that includes the following relationships: Actual results for this month and last month are as follows: Instructions 1.Analyze these data to verify whether they support the expected relationship between the strategic objectives and performance metrics. 2.Identify three possible reasons for any unsupported relationship you identified in part (1). 3.Which of the three possibilities you identified in part (2) is the most likely reason for the unsupported relationship you identified in part (1)?arrow_forwardThe controller of Emery, Inc. has computed quality costs as a percentage of sales for the past 5 years (20X1 was the first year the company implemented a quality improvement program). This information is as follows: Required: 1. Prepare a trend graph for total quality costs. Comment on what the graph has to say about the success of the quality improvement program. 2. Prepare a graph that shows the trend for each quality cost category. What does the graph have to say about the success of the quality improvement program? Does this graph supply more insight than the total cost trend graph does? 3. Prepare a graph that compares the trend in relative control costs versus relative failure costs. Comment on the significance of this trend.arrow_forward(J) Citations are required for this exercise. Comments to other students must be detailed and substantive. Alpaca Industries, located in the beauty pacific Northwest, manufactures a household electronic device. The company is fairly small with revenues and total assets of approximately $370,000 and $300,000, respectively. The company has never maintained a budget since its inception, and as a new hire, you are eager to create a budget for the company. Write a 1-page memo, explaining to the owner the advantages of budgeting. In your memo, provide exact page number citations. Please note that any responses without citations will not be graded. Only the original responses are graded; subsequent edits are not graded.arrow_forward
- Classify costs and make a quality-initiative decision (Learning Objective 5) Sinclair Corp. manufactures radiation-shielding glass panels . Suppose Sinclair is consider-ing spending the following amounts on a new TOM program :Strength-testing one item from each batch of panels ......................... . Training employees in TOM ................................................................. . Training suppliers in TOM .................................................................... . Identifying preferred suppliers that commit to on-time delivery ofperfect quality materials ................................................................... .Sinclair expects the new program to save costs through the following:Avoid lost profits from lost sales due to disappointed customers ....... Avoid rework and spoilage ................................................................. .. Avoid inspection of raw materials ........................................................ . Avoid…arrow_forwardRoberds Tech is a for-profit vocational school. The school bases its budgets on two measures of activity (i.e., cost drivers), namely student and course. The school uses the following data in its budgeting: Fixed element per month Variable element per student Variable element per course Revenue $ 0 $ 298 $ 0 Faculty wages $ 0 $ 0 $ 3,100 Course supplies $ 0 $ 52 $ 40 Administrative expenses $ 26,500 $ 27 $ 52 In March, the school budgeted for 1,910 students and 88 courses. The school's income statement showing the actual results for the month appears below: Roberds Tech Income Statement For the Month Ended March 31 Actual students 1,810 Actual courses 91 Revenue $ 411,340 Expenses: Faculty wages 214,950 Course supplies 62,590 Administrative expenses 84,562 Total expense 362,102 Net operating income $ 49,238 Required: Prepare a flexible budget performance report showing both the school's activity variances and revenue and spending…arrow_forwardShawnTech is a for-profit vocational school. The school bases its budgets on two measures of activity (i.e., cost drivers), namely student and course. The school uses the following data in its budgeting: Fixed element per month variable element per student variable element per course revenue $0 $354 $0 faculty wages $0 $0 $2,300 course supplies $0 $48 $40 administrative expenses $41,700 $13 $21 In October, the school budgeted for 1,400 students and 127 courses. The actual activity for the month was 1,500 students and 129 courses. Prepare a report showing the school's activity variances for October. Label each variance as favorable (F) or unfavorable (U).arrow_forward
- Performance Aid, Inc. has two divisions: Test Preparation and Language Arts. Results (in millions) for the past three years are partially displayed here: Q.Complete the table by filling in the blanks.arrow_forwardDetermine if the selection of system 1 or 2 is sensitive to variation in the return required by management. The corporate MARR ranges from 8% to16% per year on different projects. Use tabulated factors or a spreadsheet, as requested by your instructor.arrow_forwardApproximately 1.65 million high school students take the Scholastic Aptitude Test (SAT) each year, and nearly 80 percent of the college and universities without open admissions policies use SAT scores in making admission decisions. The current version of the SAT includes three parts: reading comprehension, mathematics, and writing. A perfect combined score for all three parts is 2400. A sample of SAT scores for the combined three-part SAT are as follows: a. Show a frequency distribution and histogram. Begin with the first bin starting at 800, and use a bin width of 200. b. Comment on the shape of the distribution. c. What other observations can be made about the SAT scores based on the tabular and graphical summaries?arrow_forward
arrow_back_ios
SEE MORE QUESTIONS
arrow_forward_ios
Recommended textbooks for you
 Managerial Accounting: The Cornerstone of Busines...AccountingISBN:9781337115773Author:Maryanne M. Mowen, Don R. Hansen, Dan L. HeitgerPublisher:Cengage Learning
 Financial And Managerial AccountingAccountingISBN:9781337902663Author:WARREN, Carl S.Publisher:Cengage Learning,
 Managerial AccountingAccountingISBN:9781337912020Author:Carl Warren, Ph.d. Cma William B. TaylerPublisher:South-Western College Pub
 Essentials of Business Analytics (MindTap Course ...StatisticsISBN:9781305627734Author:Jeffrey D. Camm, James J. Cochran, Michael J. Fry, Jeffrey W. Ohlmann, David R. AndersonPublisher:Cengage Learning
 Cornerstones of Cost Management (Cornerstones Ser...AccountingISBN:9781305970663Author:Don R. Hansen, Maryanne M. MowenPublisher:Cengage Learning
Managerial Accounting: The Cornerstone of Busines...
Accounting
ISBN:9781337115773
Author:Maryanne M. Mowen, Don R. Hansen, Dan L. Heitger
Publisher:Cengage Learning
Financial And Managerial Accounting
Accounting
ISBN:9781337902663
Author:WARREN, Carl S.
Publisher:Cengage Learning,
Managerial Accounting
Accounting
ISBN:9781337912020
Author:Carl Warren, Ph.d. Cma William B. Tayler
Publisher:South-Western College Pub
Essentials of Business Analytics (MindTap Course ...
Statistics
ISBN:9781305627734
Author:Jeffrey D. Camm, James J. Cochran, Michael J. Fry, Jeffrey W. Ohlmann, David R. Anderson
Publisher:Cengage Learning
Cornerstones of Cost Management (Cornerstones Ser...
Accounting
ISBN:9781305970663
Author:Don R. Hansen, Maryanne M. Mowen
Publisher:Cengage Learning
What is variance analysis?; Author: Corporate finance institute;https://www.youtube.com/watch?v=SMTa1lZu7Qw;License: Standard YouTube License, CC-BY