
Elementary Statistics: Picturing the World (7th Edition)
7th Edition
ISBN: 9780134683416
Author: Ron Larson, Betsy Farber
Publisher: PEARSON
expand_more
expand_more
format_list_bulleted
Videos
Textbook Question
Chapter 10.1, Problem 7E
Using and Interpreting Concepts
Performing a Chi-Square Goodness-of-Fit Test In Exercises 7−16, (a) identify the claim and state H0 and Ha, (h) find the critical value and identify the rejection region, (c) find the chi-square test statistic, (d) decide whether to reject or fail to reject the null hypothesis, and (e) interpret the decision in the context of the original claim.
7. Ages of Moviegoers A researcher claims that the ages of people who go to movies at least once a month are distributed as shown in the figure. You randomly select 1000 people who go to movies at least once a month and record the age of each. The table shows the results. At α = 0.10, test the researcher's claim.
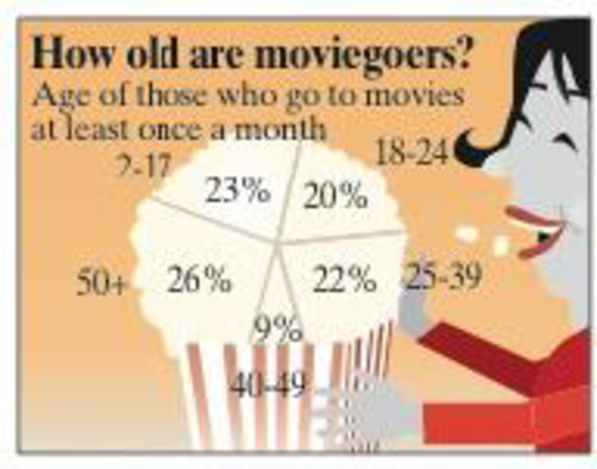
| Survey results | |
| Age | Frequency, f |
| 2−17 | 240 |
| 18−24 | 209 |
| 25−39 | 203 |
| 40−49 | 106 |
| 50+ | 242 |
Expert Solution & Answer
Want to see the full answer?
Check out a sample textbook solution
Students have asked these similar questions
Testing Hypotheses. In Exercises 13–24, assume that a simple random sample has been selected and test the given claim. Unless specified by your instructor, use either the P-value method or the critical value method for testing hypotheses. Identify the null and alternative hypotheses, test statistic, P-value (or range of P-values), or critical value(s), and state the final conclusion that addresses the original claim.
Lead in Medicine Listed below are the lead concentrations (in μ g/g) measured in different Ayurveda medicines. Ayurveda is a traditional medical system commonly used in India. The lead concentrations listed here are from medicines manufactured in the United States (based on data from “Lead, Mercury, and Arsenic in US and Indian Manufactured Ayurvedic Medicines Sold via the Internet,” by Saper et al., Journal of the American Medical Association, Vol. 300, No. 8). Use a 0.05 significance level to test the claim that the mean lead concentration for all such medicines is…
Testing Claims About Proportions. In Exercises 7–22, test the given claim. Identify the null hypothesis, alternative hypothesis, test statistic, P-value or critical value(s), then state the conclusion about the null hypothesis, as well as the final conclusion that addresses the original claim.
Clinical Trials of OxyContin OxyContin (oxycodone) is a drug used to treat pain, but it is well known for its addictiveness and danger. In a clinical trial, among subjects treated with OxyContin, 52 developed nausea and 175 did not develop nausea. Among other subjects given placebos, 5 developed nausea and 40 did not develop nausea (based on data from Purdue Pharma L.P.). Use a 0.05 significance level to test for a difference between the rates of nausea for those treated with OxyContin and those given a placebo.
a. Use a hypothesis test.
b. Use an appropriate confidence interval.
c. Does nausea appear to be an adverse reaction resulting from OxyContin?
Testing Claims About Variation. In Exercises 5–16, test the given claim. Identify the null hypothesis, alternative hypothesis, test statistic, P-value, or critical value(s), then state the conclusion about the null hypothesis, as well as the final conclusion that addresses the original claim. Assume that a simple random sample is selected from a normally distributed population.
Bank Lines The Jefferson Valley Bank once had a separate customer waiting line at each teller window, but it now has a single waiting line that feeds the teller windows as vacancies occur. The standard deviation of customer waiting times with the old multiple-line configuration was 1.8 min. Listed below is a simple random sample of waiting times (minutes) with the single waiting line. Use a 0.05 significance level to test the claim that with a single waiting line, the waiting times have a standard deviation less than 1.8 min. What improvement occurred when banks changed from multiple waiting lines to a single…
Chapter 10 Solutions
Elementary Statistics: Picturing the World (7th Edition)
Ch. 10.1 - The tax preparation company in Example 1 decides...Ch. 10.1 - Prob. 2TYCh. 10.1 - Prob. 3TYCh. 10.1 - What is a multinomial experiment?Ch. 10.1 - What conditions are necessary to use the...Ch. 10.1 - Finding Expected Frequencies In Exercises 36, find...Ch. 10.1 - Finding Expected Frequencies In Exercises 36, find...Ch. 10.1 - Finding Expected Frequencies In Exercises 36, find...Ch. 10.1 - Finding Expected Frequencies In Exercises 36, find...Ch. 10.1 - Using and Interpreting Concepts Performing a...
Ch. 10.1 - Coffee A researcher claims that the numbers of...Ch. 10.1 - Performing a Chi-Square Goodness-of-Fit Test In...Ch. 10.1 - Performing a Chi-Square Goodness-of-Fit Test In...Ch. 10.1 - Performing a Chi-Square Goodness-of-Fit Test In...Ch. 10.1 - Performing a Chi-Square Goodness-of-Fit Test In...Ch. 10.1 - Performing a Chi-Square Goodness-of-Fit Test In...Ch. 10.1 - Performing a Chi-Square Goodness-of-Fit Test In...Ch. 10.1 - Performing a Chi-Square Goodness-of-Fit Test In...Ch. 10.1 - Performing a Chi-Square Goodness-of-Fit Test In...Ch. 10.1 - In Exercises 17 and 18, (a) find the expected...Ch. 10.1 - In Exercises 17 and 18, (a) find the expected...Ch. 10.2 - The marketing consultant for a travel agency wants...Ch. 10.2 - Prob. 2TYCh. 10.2 - Prob. 3TYCh. 10.2 - Prob. 1ECh. 10.2 - Explain the difference between marginal...Ch. 10.2 - Prob. 3ECh. 10.2 - Prob. 4ECh. 10.2 - Prob. 5ECh. 10.2 - True or False? In Exercises 5 and 6, determine...Ch. 10.2 - Finding Expected Frequencies In Exercises 712, (a)...Ch. 10.2 - Finding Expected Frequencies In Exercises 712, (a)...Ch. 10.2 - Prob. 9ECh. 10.2 - Prob. 10ECh. 10.2 - Prob. 11ECh. 10.2 - Prob. 12ECh. 10.2 - Performing a Chi-Square Independence Test In...Ch. 10.2 - Prob. 14ECh. 10.2 - Performing a Chi-Square Independence Test In...Ch. 10.2 - Performing a Chi-Square Independence Test In...Ch. 10.2 - Performing a Chi-Square Independence Test In...Ch. 10.2 - Performing a Chi-Square Independence Test In...Ch. 10.2 - Prob. 19ECh. 10.2 - Performing a Chi-Square Independence Test In...Ch. 10.2 - Prob. 21ECh. 10.2 - Performing a Chi-Square Independence Test In...Ch. 10.2 - Performing a Chi-Square Independence Test In...Ch. 10.2 - Prob. 24ECh. 10.2 - Prob. 25ECh. 10.2 - Prob. 26ECh. 10.2 - Prob. 27ECh. 10.2 - Prob. 28ECh. 10.2 - Motor Vehicle Crash Deaths The contingency table...Ch. 10.2 - Prob. 30ECh. 10.2 - Prob. 31ECh. 10.2 - Prob. 32ECh. 10.2 - Prob. 33ECh. 10.2 - Prob. 34ECh. 10.2 - Prob. 35ECh. 10.2 - Contingency Tables and Relative Frequencies In...Ch. 10.2 - Prob. 37ECh. 10.2 - Prob. 38ECh. 10.2 - Prob. 39ECh. 10.2 - Conditional Relative Frequencies In Exercises...Ch. 10.2 - Conditional Relative Frequencies In Exercises...Ch. 10.2 - Prob. 42ECh. 10.2 - In your opinion, how safe is the food you buy? CBS...Ch. 10.2 - In your opinion, how safe is the food you buy? CBS...Ch. 10.2 - In your opinion, how safe is the food you buy? CBS...Ch. 10.2 - In your opinion, how safe is the food you buy? CBS...Ch. 10.2 - In your opinion, how safe is the food you buy? CBS...Ch. 10.2 - In your opinion, how safe is the food you buy? CBS...Ch. 10.3 - Find the critical F-value for a right-tailed test...Ch. 10.3 - Prob. 2TYCh. 10.3 - Prob. 3TYCh. 10.3 - Prob. 4TYCh. 10.3 - Explain how to find the critical value for an...Ch. 10.3 - List five properties of the F-distribution.Ch. 10.3 - List the three conditions that must be met in...Ch. 10.3 - Explain how to determine the values of d.f.N and...Ch. 10.3 - Prob. 5ECh. 10.3 - Prob. 6ECh. 10.3 - Prob. 7ECh. 10.3 - Finding a Critical F-Value for a Right-Tailed Test...Ch. 10.3 - Prob. 9ECh. 10.3 - Finding a Critical F-Value for a Right-Tailed Test...Ch. 10.3 - Finding a Critical F-Value for a Right-Tailed Test...Ch. 10.3 - Finding a Critical F-Value for a Right-Tailed Test...Ch. 10.3 - In Exercises 1318, test the claim about the...Ch. 10.3 - In Exercises 1318, test the claim about the...Ch. 10.3 - Prob. 15ECh. 10.3 - Prob. 16ECh. 10.3 - Prob. 17ECh. 10.3 - In Exercises 1318, test the claim about the...Ch. 10.3 - Performing a Two-Sample F-Test In Exercises 1926,...Ch. 10.3 - Prob. 20ECh. 10.3 - Performing a Two-Sample F-Test In Exercises 1926,...Ch. 10.3 - Performing a Two-Sample F-Test In Exercises 1926,...Ch. 10.3 - Performing a Two-Sample F-Test In Exercises 1926,...Ch. 10.3 - Prob. 24ECh. 10.3 - Prob. 25ECh. 10.3 - Performing a Two-Sample F-Test In Exercises 1926,...Ch. 10.3 - Prob. 27ECh. 10.3 - In Exercises 27 and 28, find the right- and...Ch. 10.3 - In Exercises 29 and 30, construct the confidence...Ch. 10.3 - In Exercises 29 and 30, construct the confidence...Ch. 10.4 - A sales analyst wants to determine whether there...Ch. 10.4 - Prob. 2TYCh. 10.4 - Slate the null and alternative hypotheses for a...Ch. 10.4 - What conditions are necessary in order to use a...Ch. 10.4 - Describe the difference between the variance...Ch. 10.4 - Prob. 4ECh. 10.4 - Performing a One-Way ANOVA Test In Exercises 514,...Ch. 10.4 - Performing a One-Way ANOVA Test In Exercises 514,...Ch. 10.4 - Performing a One-Way ANOVA Test In Exercises 514,...Ch. 10.4 - Prob. 8ECh. 10.4 - Prob. 9ECh. 10.4 - Performing a One-Way ANOVA Test In Exercises 514,...Ch. 10.4 - Performing a One-Way ANOVA Test In Exercises 514,...Ch. 10.4 - Prob. 12ECh. 10.4 - Performing a One-Way ANOVA Test In Exercises 514,...Ch. 10.4 - Performing a One-Way ANOVA Test In Exercises 514,...Ch. 10.4 - Prob. 15ECh. 10.4 - Prob. 16ECh. 10.4 - Prob. 17ECh. 10.4 - Prob. 18ECh. 10.4 - The Scheff Test If the null hypothesis is rejected...Ch. 10.4 - Prob. 20ECh. 10.4 - Prob. 21ECh. 10.4 - Prob. 22ECh. 10 - In Exercises 14. (a) identify the claim and state...Ch. 10 - In Exercises 14. (a) identify the claim and state...Ch. 10 - In Exercises 14, (a) identify the claim and state...Ch. 10 - Prob. 10.1.4RECh. 10 - Prob. 10.2.5RECh. 10 - In Exercises 58, (a) find the expected frequency...Ch. 10 - In Exercises 58, (a) find the expected frequency...Ch. 10 - In Exercises 58, (a) find the expected frequency...Ch. 10 - Prob. 10.3.9RECh. 10 - Prob. 10.3.10RECh. 10 - Prob. 10.3.11RECh. 10 - Prob. 10.3.12RECh. 10 - Prob. 10.3.13RECh. 10 - Prob. 10.3.14RECh. 10 - Prob. 10.3.15RECh. 10 - Prob. 10.3.16RECh. 10 - Prob. 10.3.17RECh. 10 - Prob. 10.3.18RECh. 10 - Prob. 10.3.19RECh. 10 - Prob. 10.3.20RECh. 10 - Prob. 10.4.21RECh. 10 - In Exercises 21 and 22, (a) identify the claim and...Ch. 10 - Prob. 1CQCh. 10 - Prob. 2CQCh. 10 - Take this quiz as you would take a quiz in class....Ch. 10 - Prob. 4CQCh. 10 - In each exercise, (a) identify the claim and state...Ch. 10 - Prob. 2CTCh. 10 - In each exercise, (a) identify the claim and state...Ch. 10 - Prob. 4CTCh. 10 - Prob. 5CTCh. 10 - Prob. 6CTCh. 10 - Goodness-of-Fit The table at the right shows an...Ch. 10 - Independence The contingency table below shows the...Ch. 10 - Prob. 1TCh. 10 - Prob. 2TCh. 10 - Prob. 3TCh. 10 - Teacher Salaries The Illinois State Board of...Ch. 10 - Repeat Exercises 14 using the data in the table...Ch. 10 - The table below shows the winning times (in...Ch. 10 - Prob. 2CRCh. 10 - The equation used to predict the annual sweet...Ch. 10 - Prob. 4CRCh. 10 - Prob. 5CRCh. 10 - Reviewing a Movie The contingency table shows how...Ch. 10 - Prob. 7CR
Knowledge Booster


Learn more about
Need a deep-dive on the concept behind this application? Look no further. Learn more about this topic, statistics and related others by exploring similar questions and additional content below.Similar questions
- Testing Claims About Proportions. In Exercises 7–22, test the given claim. Identify the null hypothesis, alternative hypothesis, test statistic, P-value or critical value(s), then state the conclusion about the null hypothesis, as well as the final conclusion that addresses the original claim. Does Aspirin Prevent Heart Disease? In a trial designed to test the effectiveness of aspirin in preventing heart disease, 11,037 male physicians were treated with aspirin and 11,034 male physicians were given placebos. Among the subjects in the aspirin treatment group, 139 experienced myocardial infarctions (heart attacks). Among the subjects given placebos, 239 experienced myocardial infarctions (based on data from “Final Report on the Aspirin Component of the Ongoing Physicians’ Health Study,” New England Journal of Medicine , Vol. 321: 129–135). Use a 0.05 significance level to test the claim that aspirin has no effect on myocardial infarctions. a. Test the claim using a hypothesis test. b.…arrow_forwardTesting Claims About Variation. In Exercises 5–16, test the given claim. Identify the null hypothesis, alternative hypothesis, test statistic, P-value, or critical value(s), then state the conclusion about the null hypothesis, as well as the final conclusion that addresses the original claim. Assume that a simple random sample is selected from a normally distributed population. Aircraft Altimeters The Skytek Avionics company uses a new production method to manufacture aircraft altimeters. A simple random sample of new altimeters resulted in the errors listed below. Use a 0.05 level of significance to test the claim that the new production method has errors with a standard deviation greater than 32.2 ft, which was the standard deviation for the old production method. If it appears that the standard deviation is greater, does the new production method appear to be better or worse than the old method? Should the company take any action?arrow_forwardTesting Claims About Proportions. In Exercises 7–22, test the given claim. Identify the null hypothesis, alternative hypothesis, test statistic, P-value or critical value(s), then state the conclusion about the null hypothesis, as well as the final conclusion that addresses the original claim. Cell Phones and Handedness A study was conducted to investigate the association between cell phone use and hemispheric brain dominance. Among 216 subjects who prefer to use their left ear for cell phones, 166 were right-handed. Among 452 subjects who prefer to use their right ear for cell phones, 436 were right-handed (based on data from “Hemispheric Dominance and Cell Phone Use,” by Seidman et al., JAMA Otolaryngology—Head & Neck Surgery, Vol. 139, No. 5). We want to use a 0.01 significance level to test the claim that the rate of right-handedness for those who prefer to use their left ear for cell phones is less than the rate of right-handedness for those who prefer to use their right ear…arrow_forward
- Testing Claims About Variation. In Exercises 5–16, test the given claim. Identify the null hypothesis, alternative hypothesis, test statistic, P-value, or critical value(s), then state the conclusion about the null hypothesis, as well as the final conclusion that addresses the original claim. Assume that a simple random sample is selected from a normally distributed population. Mint Specs Listed below are weights (grams) from a simple random sample of “wheat” pennies (from Data Set 29 “Coin Weights” in Appendix B). U.S. Mint specifications now require a standard deviation of 0.0230 g for weights of pennies. Use a 0.01 significance level to test the claim that wheat pennies are manufactured so that their weights have a standard deviation equal to 0.0230 g. Does the Mint specification appear to be met?arrow_forwardTesting Claims about Proportions. In Exercises test the given claim. Identify the null hypothesis, alternative hypothesis, test statistic, P-value or critical value(s), conclusion about the null hypothesis, and final conclusion that addresses the original claim. Headache Treatment In a study of treatments for very painful “cluster” headaches, 150 patients were treated with oxygen and 148 other patients were given a placebo consisting of ordinary air. Among the 150 patients in the oxygen treatment group, 116 were free from headaches 15 minutes after treatment. Among the 148 patients given the placebo, 29 were free from headaches 15 minutes after treatment (based on data from “High-Flow Oxygen for Treatment of Cluster Headache,” by Cohen, Burns, and Goadsby, Journal of the American Medical Association, Vol. 302, No. 22). We want to use a 0.01 significance level to test the claim that the oxygen treatment is effective. a. Test the claim using a hypothesis test. b. Test the claim by…arrow_forwardTesting Claims About Variation. In Exercises 5–16, test the given claim. Identify the null hypothesis, alternative hypothesis, test statistic, P-value, or critical value(s), then state the conclusion about the null hypothesis, as well as the final conclusion that addresses the original claim. Assume that a simple random sample is selected from a normally distributed population. Spoken Words Couples were recruited for a study of how many words people speak in a day. A random sample of 56 males resulted in a mean of 16,576 words and a standard deviation of 7871 words. Use a 0.01 significance level to test the claim that males have a standard deviation that is greater than the standard deviation of 7460 words for females (based on Data Set 24 “Word Counts”).arrow_forward
- Identify the claim and state Ho and H Determine whether the hypothesis test is left-tailed, right-tailed, or two-tailed, and whether to use a z-test, a t-test, or a chi-square test. Explain your reasoning. Find the critical value(s), identify the rejection region(s), and find the appropriate standardized test statistic. Decide whether to reject or fail to reject the null hypothesis. Interpret the decision in the context of the original claim. A tourist agency in Nevada claims the mean daily cost of meals and lodging for two adults traveling in the state is more than $300. You work for a consumer protection advocate and want to test this claim. In a random sample 35 pairs of adults traveling in Nevada, the mean daily cost of meals and lodging is $316. Assume the population standard deviation is $30. At α = 0.10, do you have enough evidence to support the agency’s claim?arrow_forwardTesting Claims About Variation. In Exercises 5–16, test the given claim. Identify the null hypothesis, alternative hypothesis, test statistic, P-value, or critical value(s), then state the conclusion about the null hypothesis, as well as the final conclusion that addresses the original claim. Assume that a simple random sample is selected from a normally distributed population. Fast Food Drive-Through Service Times Listed below are drive-through service times (seconds) recorded at McDonald’s during dinner times (from Data Set 25 “Fast Food” in Appendix B). Assuming that dinner service times at Wendy’s have standard deviation σ = 55.93 sec, use a 0.01 significance level to test the claim that service times at McDonald’s have the same variation as service times at Wendy’s. Should McDonald’s take any action?arrow_forwardTesting Claims About Proportions. In Exercises 7–22, test the given claim. Identify the null hypothesis, alternative hypothesis, test statistic, P-value or critical value(s), then state the conclusion about the null hypothesis, as well as the final conclusion that addresses the original claim. Denomination Effect A trial was conducted with 75 women in China given a 100-yuan bill, while another 75 women in China were given 100 yuan in the form of smaller bills (a 50-yuan bill plus two 20-yuan bills plus two 5-yuan bills). Among those given the single bill, 60 spent some or all of the money. Among those given the smaller bills, 68 spent some or all of the money (based on data from “The Denomination Effect,” by Raghubir and Srivastava, Journal of Consumer Research, Vol. 36). We want to use a 0.05 significance level to test the claim that when given a single large bill, a smaller proportion of women in China spend some or all of the money when compared to the proportion of women in China…arrow_forward
- Testing Claims About Variation. In Exercises 5–16, test the given claim. Identify the null hypothesis, alternative hypothesis, test statistic, P-value, or critical value(s), then state the conclusion about the null hypothesis, as well as the final conclusion that addresses the original claim. Assume that a simple random sample is selected from a normally distributed population. Pulse Rates of Women Repeat the preceding exercise using the pulse rates of women listed in Data Set 1 “Body Data” in Appendix B. For the sample of pulse rates of women, n = 147 and s = 12.5. See the accompanying JMP display that results from using the original list of pulse rates instead of the summary statistics. (Hint: The bottom three rows of the display provide P -values for a two-tailed test, a left-tailed test, and a right-tailed test, respectively.) What do the results indicate about the effectiveness of using the range rule of thumb with the “normal range” from 60 to 100 beats per minute for estimating…arrow_forwardFinding Critical Values and Confidence Intervals. In Exercises 5–8, use the given information to find the number of degrees of freedom, the critical values χ2L and X2R, and the confidence interval estimate of σ. The samples are from Appendix B and it is reasonable to assume that a simple random sample has been selected from a population with a normal distribution. Nicotine in Menthol Cigarettes 95% confidence; n = 25, s = 0.24 mg White Blood Cell Counts of Men 95% confidence; n = 153, s = 1.86. Platelet Counts of Women 99% confidence; n = 147, s = 65.4. Heights of Men 99% confidence; n = 153, s = 7.10 cmarrow_forwardUsing Nonparametric Tests. In Exercises 1–10, use a 0.05 significance level with the indicated test. If no particular test is specified, use the appropriate nonparametric test from this chapter. Speed Dating In a study of speed dating conducted at Columbia University, female subjects were asked to rate the attractiveness of their male dates, and a sample of the results is listed below (1 = not attractive; 10 = extremely attractive). Use the sign test to test the claim that the sample is from a population with a median equal to 5.arrow_forward
arrow_back_ios
SEE MORE QUESTIONS
arrow_forward_ios
Recommended textbooks for you
 Functions and Change: A Modeling Approach to Coll...AlgebraISBN:9781337111348Author:Bruce Crauder, Benny Evans, Alan NoellPublisher:Cengage Learning
Functions and Change: A Modeling Approach to Coll...
Algebra
ISBN:9781337111348
Author:Bruce Crauder, Benny Evans, Alan Noell
Publisher:Cengage Learning
Hypothesis Testing using Confidence Interval Approach; Author: BUM2413 Applied Statistics UMP;https://www.youtube.com/watch?v=Hq1l3e9pLyY;License: Standard YouTube License, CC-BY
Hypothesis Testing - Difference of Two Means - Student's -Distribution & Normal Distribution; Author: The Organic Chemistry Tutor;https://www.youtube.com/watch?v=UcZwyzwWU7o;License: Standard Youtube License