
Elementary Statistics: Picturing the World (7th Edition)
7th Edition
ISBN: 9780134683416
Author: Ron Larson, Betsy Farber
Publisher: PEARSON
expand_more
expand_more
format_list_bulleted
Concept explainers
Videos
Textbook Question
Chapter 10, Problem 10.1.3RE
In Exercises 1−4, (a) identify the claim and state H0 and Ha, (b) find the critical value and identify the rejection region, (c) find the chi-square test statistic, (d) decide whether to reject or fail to reject the null hypothesis, and (e) interpret the decision in the context of the original claim.
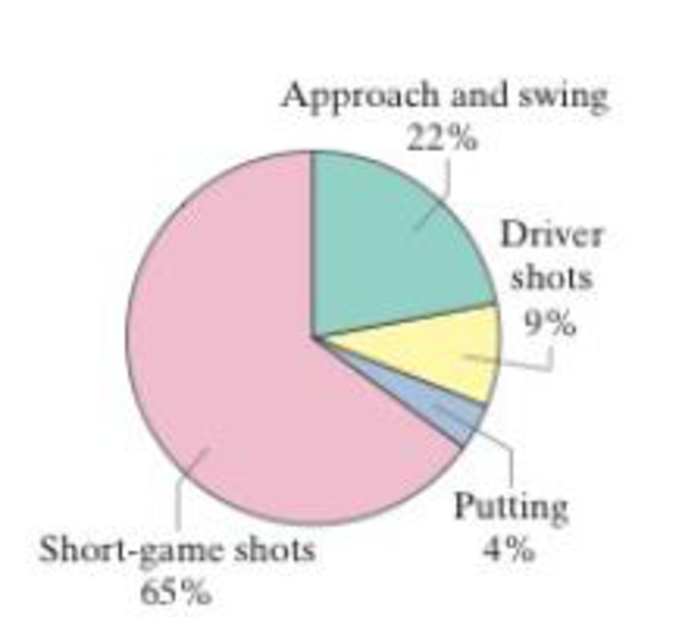
3. A sports magazine claims that the opinions of golf students about what they need the must help with in golf are distributed as shown in the pie chart. You randomly select 435 golf students and ask them what they need the most help with in golf. The table shows the results. At α = 0.05, test the sports magazine’s claim. (Adapted from PGA of America)
| Survey results | |
| Response | Frequency, f |
| Short-game shots | 276 |
| Approach and swing | 99 |
| Driver shots | 42 |
| Putting | 18 |
Expert Solution & Answer
Want to see the full answer?
Check out a sample textbook solution
Students have asked these similar questions
A geneticist conducted a hybridization experiment with peas, which resulted in offspring consisting of 410 peas with green pods and 150 peas with yellow pods. According to Mendel’s theory, 1/4 of the offspring peas should have yellow pods. Use a 0.05 significance level to test the claim that the proportion of peas with yellow pods is equal to 0.25.a. H0: ______________b. HA: ______________c. Type of hypothesis test: __________________d. Critical value: ___________e. Test statistic value: ____________f. P-value: ____________g. Decision: _____________________________h. Conclusion: _____________________________________________
3. A researcher is testing a two-tailed null hypothesis at the p < .01 level with df = 45. What critical value would she or he use? Justify your answer
A humane society claims that less than 39% of U.S. households own a dog. In a random sample of 402 U.S. households, 155say they own a dog. At α=0.01, is there enough evidence to support the society's claim?
(a) Write the claim mathematically and identify
H0 and Ha.
(b) Find the critical value(s) and identify the rejection region(s).
(c) Find the standardized test statistic.
(d) Decide whether to reject or fail to reject the null hypothesis, and (e) interpret the decision in the context of the original claim.
Chapter 10 Solutions
Elementary Statistics: Picturing the World (7th Edition)
Ch. 10.1 - The tax preparation company in Example 1 decides...Ch. 10.1 - Prob. 2TYCh. 10.1 - Prob. 3TYCh. 10.1 - What is a multinomial experiment?Ch. 10.1 - What conditions are necessary to use the...Ch. 10.1 - Finding Expected Frequencies In Exercises 36, find...Ch. 10.1 - Finding Expected Frequencies In Exercises 36, find...Ch. 10.1 - Finding Expected Frequencies In Exercises 36, find...Ch. 10.1 - Finding Expected Frequencies In Exercises 36, find...Ch. 10.1 - Using and Interpreting Concepts Performing a...
Ch. 10.1 - Coffee A researcher claims that the numbers of...Ch. 10.1 - Performing a Chi-Square Goodness-of-Fit Test In...Ch. 10.1 - Performing a Chi-Square Goodness-of-Fit Test In...Ch. 10.1 - Performing a Chi-Square Goodness-of-Fit Test In...Ch. 10.1 - Performing a Chi-Square Goodness-of-Fit Test In...Ch. 10.1 - Performing a Chi-Square Goodness-of-Fit Test In...Ch. 10.1 - Performing a Chi-Square Goodness-of-Fit Test In...Ch. 10.1 - Performing a Chi-Square Goodness-of-Fit Test In...Ch. 10.1 - Performing a Chi-Square Goodness-of-Fit Test In...Ch. 10.1 - In Exercises 17 and 18, (a) find the expected...Ch. 10.1 - In Exercises 17 and 18, (a) find the expected...Ch. 10.2 - The marketing consultant for a travel agency wants...Ch. 10.2 - Prob. 2TYCh. 10.2 - Prob. 3TYCh. 10.2 - Prob. 1ECh. 10.2 - Explain the difference between marginal...Ch. 10.2 - Prob. 3ECh. 10.2 - Prob. 4ECh. 10.2 - Prob. 5ECh. 10.2 - True or False? In Exercises 5 and 6, determine...Ch. 10.2 - Finding Expected Frequencies In Exercises 712, (a)...Ch. 10.2 - Finding Expected Frequencies In Exercises 712, (a)...Ch. 10.2 - Prob. 9ECh. 10.2 - Prob. 10ECh. 10.2 - Prob. 11ECh. 10.2 - Prob. 12ECh. 10.2 - Performing a Chi-Square Independence Test In...Ch. 10.2 - Prob. 14ECh. 10.2 - Performing a Chi-Square Independence Test In...Ch. 10.2 - Performing a Chi-Square Independence Test In...Ch. 10.2 - Performing a Chi-Square Independence Test In...Ch. 10.2 - Performing a Chi-Square Independence Test In...Ch. 10.2 - Prob. 19ECh. 10.2 - Performing a Chi-Square Independence Test In...Ch. 10.2 - Prob. 21ECh. 10.2 - Performing a Chi-Square Independence Test In...Ch. 10.2 - Performing a Chi-Square Independence Test In...Ch. 10.2 - Prob. 24ECh. 10.2 - Prob. 25ECh. 10.2 - Prob. 26ECh. 10.2 - Prob. 27ECh. 10.2 - Prob. 28ECh. 10.2 - Motor Vehicle Crash Deaths The contingency table...Ch. 10.2 - Prob. 30ECh. 10.2 - Prob. 31ECh. 10.2 - Prob. 32ECh. 10.2 - Prob. 33ECh. 10.2 - Prob. 34ECh. 10.2 - Prob. 35ECh. 10.2 - Contingency Tables and Relative Frequencies In...Ch. 10.2 - Prob. 37ECh. 10.2 - Prob. 38ECh. 10.2 - Prob. 39ECh. 10.2 - Conditional Relative Frequencies In Exercises...Ch. 10.2 - Conditional Relative Frequencies In Exercises...Ch. 10.2 - Prob. 42ECh. 10.2 - In your opinion, how safe is the food you buy? CBS...Ch. 10.2 - In your opinion, how safe is the food you buy? CBS...Ch. 10.2 - In your opinion, how safe is the food you buy? CBS...Ch. 10.2 - In your opinion, how safe is the food you buy? CBS...Ch. 10.2 - In your opinion, how safe is the food you buy? CBS...Ch. 10.2 - In your opinion, how safe is the food you buy? CBS...Ch. 10.3 - Find the critical F-value for a right-tailed test...Ch. 10.3 - Prob. 2TYCh. 10.3 - Prob. 3TYCh. 10.3 - Prob. 4TYCh. 10.3 - Explain how to find the critical value for an...Ch. 10.3 - List five properties of the F-distribution.Ch. 10.3 - List the three conditions that must be met in...Ch. 10.3 - Explain how to determine the values of d.f.N and...Ch. 10.3 - Prob. 5ECh. 10.3 - Prob. 6ECh. 10.3 - Prob. 7ECh. 10.3 - Finding a Critical F-Value for a Right-Tailed Test...Ch. 10.3 - Prob. 9ECh. 10.3 - Finding a Critical F-Value for a Right-Tailed Test...Ch. 10.3 - Finding a Critical F-Value for a Right-Tailed Test...Ch. 10.3 - Finding a Critical F-Value for a Right-Tailed Test...Ch. 10.3 - In Exercises 1318, test the claim about the...Ch. 10.3 - In Exercises 1318, test the claim about the...Ch. 10.3 - Prob. 15ECh. 10.3 - Prob. 16ECh. 10.3 - Prob. 17ECh. 10.3 - In Exercises 1318, test the claim about the...Ch. 10.3 - Performing a Two-Sample F-Test In Exercises 1926,...Ch. 10.3 - Prob. 20ECh. 10.3 - Performing a Two-Sample F-Test In Exercises 1926,...Ch. 10.3 - Performing a Two-Sample F-Test In Exercises 1926,...Ch. 10.3 - Performing a Two-Sample F-Test In Exercises 1926,...Ch. 10.3 - Prob. 24ECh. 10.3 - Prob. 25ECh. 10.3 - Performing a Two-Sample F-Test In Exercises 1926,...Ch. 10.3 - Prob. 27ECh. 10.3 - In Exercises 27 and 28, find the right- and...Ch. 10.3 - In Exercises 29 and 30, construct the confidence...Ch. 10.3 - In Exercises 29 and 30, construct the confidence...Ch. 10.4 - A sales analyst wants to determine whether there...Ch. 10.4 - Prob. 2TYCh. 10.4 - Slate the null and alternative hypotheses for a...Ch. 10.4 - What conditions are necessary in order to use a...Ch. 10.4 - Describe the difference between the variance...Ch. 10.4 - Prob. 4ECh. 10.4 - Performing a One-Way ANOVA Test In Exercises 514,...Ch. 10.4 - Performing a One-Way ANOVA Test In Exercises 514,...Ch. 10.4 - Performing a One-Way ANOVA Test In Exercises 514,...Ch. 10.4 - Prob. 8ECh. 10.4 - Prob. 9ECh. 10.4 - Performing a One-Way ANOVA Test In Exercises 514,...Ch. 10.4 - Performing a One-Way ANOVA Test In Exercises 514,...Ch. 10.4 - Prob. 12ECh. 10.4 - Performing a One-Way ANOVA Test In Exercises 514,...Ch. 10.4 - Performing a One-Way ANOVA Test In Exercises 514,...Ch. 10.4 - Prob. 15ECh. 10.4 - Prob. 16ECh. 10.4 - Prob. 17ECh. 10.4 - Prob. 18ECh. 10.4 - The Scheff Test If the null hypothesis is rejected...Ch. 10.4 - Prob. 20ECh. 10.4 - Prob. 21ECh. 10.4 - Prob. 22ECh. 10 - In Exercises 14. (a) identify the claim and state...Ch. 10 - In Exercises 14. (a) identify the claim and state...Ch. 10 - In Exercises 14, (a) identify the claim and state...Ch. 10 - Prob. 10.1.4RECh. 10 - Prob. 10.2.5RECh. 10 - In Exercises 58, (a) find the expected frequency...Ch. 10 - In Exercises 58, (a) find the expected frequency...Ch. 10 - In Exercises 58, (a) find the expected frequency...Ch. 10 - Prob. 10.3.9RECh. 10 - Prob. 10.3.10RECh. 10 - Prob. 10.3.11RECh. 10 - Prob. 10.3.12RECh. 10 - Prob. 10.3.13RECh. 10 - Prob. 10.3.14RECh. 10 - Prob. 10.3.15RECh. 10 - Prob. 10.3.16RECh. 10 - Prob. 10.3.17RECh. 10 - Prob. 10.3.18RECh. 10 - Prob. 10.3.19RECh. 10 - Prob. 10.3.20RECh. 10 - Prob. 10.4.21RECh. 10 - In Exercises 21 and 22, (a) identify the claim and...Ch. 10 - Prob. 1CQCh. 10 - Prob. 2CQCh. 10 - Take this quiz as you would take a quiz in class....Ch. 10 - Prob. 4CQCh. 10 - In each exercise, (a) identify the claim and state...Ch. 10 - Prob. 2CTCh. 10 - In each exercise, (a) identify the claim and state...Ch. 10 - Prob. 4CTCh. 10 - Prob. 5CTCh. 10 - Prob. 6CTCh. 10 - Goodness-of-Fit The table at the right shows an...Ch. 10 - Independence The contingency table below shows the...Ch. 10 - Prob. 1TCh. 10 - Prob. 2TCh. 10 - Prob. 3TCh. 10 - Teacher Salaries The Illinois State Board of...Ch. 10 - Repeat Exercises 14 using the data in the table...Ch. 10 - The table below shows the winning times (in...Ch. 10 - Prob. 2CRCh. 10 - The equation used to predict the annual sweet...Ch. 10 - Prob. 4CRCh. 10 - Prob. 5CRCh. 10 - Reviewing a Movie The contingency table shows how...Ch. 10 - Prob. 7CR
Knowledge Booster


Learn more about
Need a deep-dive on the concept behind this application? Look no further. Learn more about this topic, statistics and related others by exploring similar questions and additional content below.Similar questions
- HIV/AIDS patients are regularly monitored for their CD4 counts in order to make sure that antiretroviral therapies are effectiveSuppose the distribution of CD4 counts in a population is approximately normal with mu = 237 and sigma = 43 . HIV patients are defined as moving into the AIDS stage of their disease course after their CD4 counts are less than 200. What proportion of patients in this population is suffering from AIDS?arrow_forwardFind the critical value, the computed t-value, and whether to reject or accept the null hypothesis.arrow_forward1)Remove the four potential outliers of 0, 0, 8, and 20, and then obtain a new histogram without the outliers. Does the data appear to be normally distributed now? 2)Assuming that the four potential outliers of 0, 0, 8, and 20 are not recording errors, repeat the hypothesis test from part (c) (again setting up the hypothesis test and using either the critical value or p-value approach), and compare your results with that obtained in (c). Did you make a different conclusion? 3)Imagine you know have to make a recommendation/conclusion to the company that hired you: Assuming that the four potential outlies are not recording errors, and looking at the two results above, would you recommend using the first test with the outliers or the second test with the outliers removed? There is no right or wrong answer here, I am interested in what you think and your reasoning.arrow_forward
- Historically, the proportion of people who trade in their old car to a car dealer when purchasing a new car is 48%. Over the previous six months, in a sample of 115 new car buyers, 46 have traded in their old car. To determine (at the 10% level of significance) whether the proportion of new car buyers that trade in their old car has this is  statistically significantly decreased, what can you conclude concerning the null hypothesis? A) reject the null hypothesis Or B) fail to reject the null hypothesisarrow_forward(1) Conduct a hypothesis test, at the 5% level of significance, to determine whether ? is significant (2) What would be the growth of the plant if 4g of fertilizer and 7g of ater was given to it daily? (3) Carry out an F -test at the 1% significance level to determine whether the model is significantarrow_forwardA major credit card company is interested in the proportion of individuals who use a competitor’s credit card. Their null hypothesis is H0: p=0.65H0: p=0.65, and based on a sample they find a sample proportion of 0.70 and a pp-value of 0.053. Is there convincing statistical evidence at the 0.05 level of significance that the true proportion of individuals who use the competitor’s card is actually greater than 0.65 ? Yes, because the sample proportion 0.70 is greater than the hypothesized proportion 0.65. A Yes, because the pp-value 0.053 is greater than the significance level 0.05. B No, because the sample proportion 0.70 is greater than the hypothesized proportion 0.65. C No, since the sample proportion 0.70 is exactly 0.05 away from the hypothesized proportion 0.65. D No, because the pp-value 0.053 is greater than the significance level 0.05.arrow_forward
- 2. A new chemotherapy drug is released to treat leukemia and researchers suspect that the drug may have fewer side effects than the most commonly used drug to treat leukemia. The two drugs have equivalent efficacy. In order to determine if a larger study should be conducted to look into the prevalence of side effects for the two drugs, set up a Mann-Whitney U test at the alpha equals .05 level and interpret its results.Number of Reported Side-EffectsOld Drug 0 1 3 3 5New Drug 0 0 1 2 4 A) We fail to reject H0, which states the two populations are equal at the alpha equals .05 level because the calculated U value of 16.5 is greater than the critical U value of 2.B) We fail to reject H0, which states the two populations are equal at the alpha equals .05 level because the calculated U value of 8.5 is greater than the critical U value of 2.C) We reject H0 in favor of H1, which states the two populations are not equal at the alpha equals .05 level because the calculated U value of 16.5 is…arrow_forwardA new chemotherapy drug is released to treat leukemia and researchers suspect that the drug may have fewer side effects than the most commonly used drug to treat leukemia. The two drugs have equivalent efficacy. In order to determine if a larger study should be conducted to look into the prevalence of side effects for the two drugs, set up a Mann-Whitney U test at the alpha equals .05 level and interpret its results. Number of Reported Side-Effects Old Drug 0 1 3 3 5 New Drug 0 0 1 2 4 A) We fail to reject H0, which states the two populations are equal at the alpha equals .05 level because the calculated Uvalue of 16.5 is greater than the critical U value of 2. B) We fail to reject H0, which states the two populations are equal at the alpha equals .05 level because the calculated Uvalue of 8.5 is greater than the critical U value of 2. C) We reject H0 in favor of H1, which…arrow_forwardThe average drying time of a manufacturer’s paint is 20 minutes. Investigating the effectiveness of a modifica-tion in the chemical composition of her paint, the manu-facturer wants to test the null hypothesis μ = 20 minutes against a suitable alternative, where μ is the average dry-ing time of the modified paint. (a) What alternative hypothesis should the manufactureruse if she does not want to make the modification in thechemical composition of the paint unless it decreases thedrying time?(b) What alternative hypothesis should the manufactureruse if the new process is actually cheaper and she wants tomake the modification unless it increases the drying timeof the paint?arrow_forward
- An urban community wants to show that the incidence of breast cancer is higher in their locality than in a neighboring rural area. (PCB levels were found to be higher in the soil of the urban community). If you find that in the urban community 20 out of 200 adult women have breast cancer and that in the rural community 10 out of 150 adult women have it, could you conclude, at a significance level of 0.05, that breast cancer is more prevalent in the urban community?1. The parameter of interest is:2. The hypotheses for this test are:3. The calculated test statistic is:4. The critical region is:5. Draw the critical region (make decision):6. It can be concluded that:arrow_forward. A new chemotherapy drug is released to treat leukemia and researchers suspect that the drug may have fewer side effects than the most commonly used drug to treat leukemia. The two drugs have equivalent efficacy. In order to determine if a larger study should be conducted to look into the prevalence of side effects for the two drugs, set up a Mann-Whitney U test at the alpha equals .05 level and interpret its results. Number of Reported Side-EffectsOld Drug 0 1 1 3 5New Drug 0 0 1 2 4 Old Drug New Drug Total Sample(Ordered Smallest to Largest) RanksOld Drug New Drug Old Drug New DrugR1= R2= A) We reject H0 in favor of H1, which states the two populations are not equal at the alpha equals .05 level because the calculated U value of 10 is greater than the critical U value of 2.B) We reject H0 in favor of H1, which states the two populations are not equal at the alpha equals .05 level because the calculated U value of 8.5 is greater than the critical U value of 2.C) We fail to reject H0,…arrow_forwardA major credit card company is interested in the proportion of individuals who use a competitor’s credit card. Their null hypothesis is H0: p=0.65H0: p=0.65, and based on a sample they find a sample proportion of 0.70 and a pp-value of 0.053. Is there convincing statistical evidence at the 0.05 level of significance that the true proportion of individuals who use the competitor’s card is actually greater than 0.65 ?arrow_forward
arrow_back_ios
SEE MORE QUESTIONS
arrow_forward_ios
Recommended textbooks for you
 MATLAB: An Introduction with ApplicationsStatisticsISBN:9781119256830Author:Amos GilatPublisher:John Wiley & Sons Inc
 Probability and Statistics for Engineering and th...StatisticsISBN:9781305251809Author:Jay L. DevorePublisher:Cengage Learning
 Statistics for The Behavioral Sciences (MindTap C...StatisticsISBN:9781305504912Author:Frederick J Gravetter, Larry B. WallnauPublisher:Cengage Learning
 Elementary Statistics: Picturing the World (7th E...StatisticsISBN:9780134683416Author:Ron Larson, Betsy FarberPublisher:PEARSON
 The Basic Practice of StatisticsStatisticsISBN:9781319042578Author:David S. Moore, William I. Notz, Michael A. FlignerPublisher:W. H. Freeman
 Introduction to the Practice of StatisticsStatisticsISBN:9781319013387Author:David S. Moore, George P. McCabe, Bruce A. CraigPublisher:W. H. Freeman
MATLAB: An Introduction with Applications
Statistics
ISBN:9781119256830
Author:Amos Gilat
Publisher:John Wiley & Sons Inc
Probability and Statistics for Engineering and th...
Statistics
ISBN:9781305251809
Author:Jay L. Devore
Publisher:Cengage Learning
Statistics for The Behavioral Sciences (MindTap C...
Statistics
ISBN:9781305504912
Author:Frederick J Gravetter, Larry B. Wallnau
Publisher:Cengage Learning
Elementary Statistics: Picturing the World (7th E...
Statistics
ISBN:9780134683416
Author:Ron Larson, Betsy Farber
Publisher:PEARSON
The Basic Practice of Statistics
Statistics
ISBN:9781319042578
Author:David S. Moore, William I. Notz, Michael A. Fligner
Publisher:W. H. Freeman
Introduction to the Practice of Statistics
Statistics
ISBN:9781319013387
Author:David S. Moore, George P. McCabe, Bruce A. Craig
Publisher:W. H. Freeman
Statistics 4.1 Point Estimators; Author: Dr. Jack L. Jackson II;https://www.youtube.com/watch?v=2MrI0J8XCEE;License: Standard YouTube License, CC-BY
Statistics 101: Point Estimators; Author: Brandon Foltz;https://www.youtube.com/watch?v=4v41z3HwLaM;License: Standard YouTube License, CC-BY
Central limit theorem; Author: 365 Data Science;https://www.youtube.com/watch?v=b5xQmk9veZ4;License: Standard YouTube License, CC-BY
Point Estimate Definition & Example; Author: Prof. Essa;https://www.youtube.com/watch?v=OTVwtvQmSn0;License: Standard Youtube License
Point Estimation; Author: Vamsidhar Ambatipudi;https://www.youtube.com/watch?v=flqhlM2bZWc;License: Standard Youtube License