
Videos
Performing a Chi-Square Goodness-of-Fit Test In Exercises 7−16, (a) identify the claim and state H0 and Ha, (h) find the critical value and identify the rejection region, (c) find the chi-square test statistic, (d) decide whether to reject or fail to reject the null hypothesis, and (e) interpret the decision in the context of the original claim.
14. Money Management The pie chart shows the results of a survey in which married U.S. male adults were asked how much they trust their spouses to manage their finances. A financial services company claims that the distribution of how much married U.S. female adults trust their spouses to manage their finances is the same as the distribution given for married U.S. male adults. To test this claim, you randomly select 400 married U.S. female adults and ask each how much she trusts her spouse to manage their finances. The table shows the results. At α = 0.10, test the company’s claim. (Adapted from Country Financial)
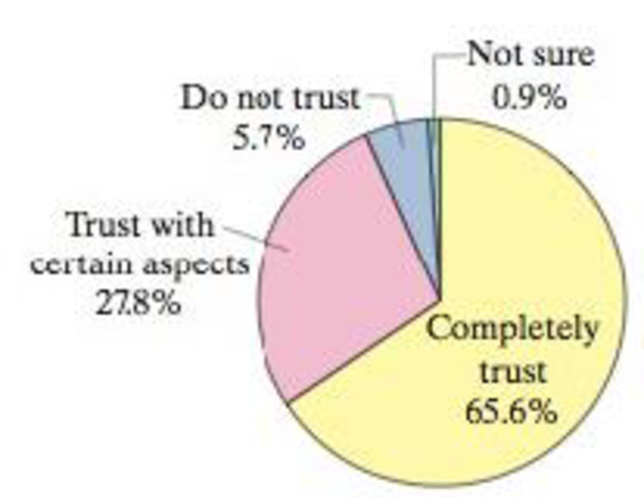
| Survey results | |
| Response | Frequency, f |
| Completely trust | 243 |
| Trust with certain | 108 |
| aspects | |
| Do not trust | 36 |
| Not sure | 13 |
Want to see the full answer?
Check out a sample textbook solution
Chapter 10 Solutions
Elementary Statistics: Picturing the World (7th Edition)


- Finding a Sample Space In Exercises 9-14, find the sample space for the experiment. You toss a coin and a six-sided die.arrow_forwardTesting Claims About Variation. In Exercises 5–16, test the given claim. Identify the null hypothesis, alternative hypothesis, test statistic, P-value, or critical value(s), then state the conclusion about the null hypothesis, as well as the final conclusion that addresses the original claim. Assume that a simple random sample is selected from a normally distributed population. Bank Lines The Jefferson Valley Bank once had a separate customer waiting line at each teller window, but it now has a single waiting line that feeds the teller windows as vacancies occur. The standard deviation of customer waiting times with the old multiple-line configuration was 1.8 min. Listed below is a simple random sample of waiting times (minutes) with the single waiting line. Use a 0.05 significance level to test the claim that with a single waiting line, the waiting times have a standard deviation less than 1.8 min. What improvement occurred when banks changed from multiple waiting lines to a single…arrow_forwardFinding Critical Values and Confidence Intervals. In Exercises 5–8, use the given information to find the number of degrees of freedom, the critical values χ2L and X2R, and the confidence interval estimate of σ. The samples are from Appendix B and it is reasonable to assume that a simple random sample has been selected from a population with a normal distribution. Nicotine in Menthol Cigarettes 95% confidence; n = 25, s = 0.24 mg White Blood Cell Counts of Men 95% confidence; n = 153, s = 1.86. Platelet Counts of Women 99% confidence; n = 147, s = 65.4. Heights of Men 99% confidence; n = 153, s = 7.10 cmarrow_forward
- Testing Claims About Variation. In Exercises 5–16, test the given claim. Identify the null hypothesis, alternative hypothesis, test statistic, P-value, or critical value(s), then state the conclusion about the null hypothesis, as well as the final conclusion that addresses the original claim. Assume that a simple random sample is selected from a normally distributed population. Aircraft Altimeters The Skytek Avionics company uses a new production method to manufacture aircraft altimeters. A simple random sample of new altimeters resulted in the errors listed below. Use a 0.05 level of significance to test the claim that the new production method has errors with a standard deviation greater than 32.2 ft, which was the standard deviation for the old production method. If it appears that the standard deviation is greater, does the new production method appear to be better or worse than the old method? Should the company take any action?arrow_forwardTesting Hypotheses. In Exercises 13–24, assume that a simple random sample has been selected and test the given claim. Unless specified by your instructor, use either the P-value method or the critical value method for testing hypotheses. Identify the null and alternative hypotheses, test statistic, P-value (or range of P-values), or critical value(s), and state the final conclusion that addresses the original claim. Car Booster Seats The National Highway Traffic Safety Administration conducted crash tests of child booster seats for cars. Listed below are results from those tests, with the measurements given in hic (standard head injury condition units). The safety requirement is that the hic measurement should be less than 1000 hic. Use a 0.01 significance level to test the claim that the sample is from a population with a mean less than 1000 hic. Do the results suggest that all of the child booster seats meet the specified requirement?arrow_forwardTesting Claims About Variation. In Exercises 5–16, test the given claim. Identify the null hypothesis, alternative hypothesis, test statistic, P-value, or critical value(s), then state the conclusion about the null hypothesis, as well as the final conclusion that addresses the original claim. Assume that a simple random sample is selected from a normally distributed population. Fast Food Drive-Through Service Times Listed below are drive-through service times (seconds) recorded at McDonald’s during dinner times (from Data Set 25 “Fast Food” in Appendix B). Assuming that dinner service times at Wendy’s have standard deviation σ = 55.93 sec, use a 0.01 significance level to test the claim that service times at McDonald’s have the same variation as service times at Wendy’s. Should McDonald’s take any action?arrow_forward
- Testing Hypotheses. In Exercises 13–24, assume that a simple random sample has been selected and test the given claim. Unless specified by your instructor, use either the P-value method or the critical value method for testing hypotheses. Identify the null and alternative hypotheses, test statistic, P-value (or range of P-values), or critical value(s), and state the final conclusion that addresses the original claim. Heights of Supermodels Listed below are the heights (cm) for the simple random sample of female supermodels Lima, Bundchen, Ambrosio, Ebanks, Iman, Rubik, Kurkova, Kerr, Kroes, Swanepoel, Prinsloo, Hosk, Kloss, Robinson, Heatherton, and Refaeli. Use a 0.01 significance level to test the claim that supermodels have heights with a mean that is greater than the mean height of 162 cm for women in the general population. Given that there are only 16 heights represented, can we really conclude that supermodels are taller than the typical woman?arrow_forwardTesting Claims About Proportions. In Exercises 7–22, test the given claim. Identify the null hypothesis, alternative hypothesis, test statistic, P-value or critical value(s), then state the conclusion about the null hypothesis, as well as the final conclusion that addresses the original claim. Denomination Effect A trial was conducted with 75 women in China given a 100-yuan bill, while another 75 women in China were given 100 yuan in the form of smaller bills (a 50-yuan bill plus two 20-yuan bills plus two 5-yuan bills). Among those given the single bill, 60 spent some or all of the money. Among those given the smaller bills, 68 spent some or all of the money (based on data from “The Denomination Effect,” by Raghubir and Srivastava, Journal of Consumer Research, Vol. 36). We want to use a 0.05 significance level to test the claim that when given a single large bill, a smaller proportion of women in China spend some or all of the money when compared to the proportion of women in China…arrow_forwardTesting Claims About Proportions. In Exercises 7–22, test the given claim. Identify the null hypothesis, alternative hypothesis, test statistic, P-value or critical value(s), then state the conclusion about the null hypothesis, as well as the final conclusion that addresses the original claim. Cell Phones and Handedness A study was conducted to investigate the association between cell phone use and hemispheric brain dominance. Among 216 subjects who prefer to use their left ear for cell phones, 166 were right-handed. Among 452 subjects who prefer to use their right ear for cell phones, 436 were right-handed (based on data from “Hemispheric Dominance and Cell Phone Use,” by Seidman et al., JAMA Otolaryngology—Head & Neck Surgery, Vol. 139, No. 5). We want to use a 0.01 significance level to test the claim that the rate of right-handedness for those who prefer to use their left ear for cell phones is less than the rate of right-handedness for those who prefer to use their right ear…arrow_forward
- Testing Claims About Variation. In Exercises 5–16, test the given claim. Identify the null hypothesis, alternative hypothesis, test statistic, P-value, or critical value(s), then state the conclusion about the null hypothesis, as well as the final conclusion that addresses the original claim. Assume that a simple random sample is selected from a normally distributed population. Mint Specs Listed below are weights (grams) from a simple random sample of “wheat” pennies (from Data Set 29 “Coin Weights” in Appendix B). U.S. Mint specifications now require a standard deviation of 0.0230 g for weights of pennies. Use a 0.01 significance level to test the claim that wheat pennies are manufactured so that their weights have a standard deviation equal to 0.0230 g. Does the Mint specification appear to be met?arrow_forwardIdentify the claim and state Ho and H Determine whether the hypothesis test is left-tailed, right-tailed, or two-tailed, and whether to use a z-test, a t-test, or a chi-square test. Explain your reasoning. Find the critical value(s), identify the rejection region(s), and find the appropriate standardized test statistic. Decide whether to reject or fail to reject the null hypothesis. Interpret the decision in the context of the original claim. A tourist agency in Nevada claims the mean daily cost of meals and lodging for two adults traveling in the state is more than $300. You work for a consumer protection advocate and want to test this claim. In a random sample 35 pairs of adults traveling in Nevada, the mean daily cost of meals and lodging is $316. Assume the population standard deviation is $30. At α = 0.10, do you have enough evidence to support the agency’s claim?arrow_forwardTesting Claims About Proportions. In Exercises 7–22, test the given claim. Identify the null hypothesis, alternative hypothesis, test statistic, P-value or critical value(s), then state the conclusion about the null hypothesis, as well as the final conclusion that addresses the original claim. License Plate Laws The Chapter Problem involved passenger cars in Connecticut and passenger cars in New York, but here we consider passenger cars and commercial trucks. Among 2049 Connecticut passenger cars, 239 had only rear license plates. Among 334 Connecticut trucks, 45 had only rear license plates (based on samples collected by the author). A reasonable hypothesis is that passenger car owners violate license plate laws at a higher rate than owners of commercial trucks. Use a 0.05 significance level to test that hypothesis. a. Test the claim using a hypothesis test. b. Test the claim by constructing an appropriate confidence interval.arrow_forward
 Functions and Change: A Modeling Approach to Coll...AlgebraISBN:9781337111348Author:Bruce Crauder, Benny Evans, Alan NoellPublisher:Cengage Learning
 College Algebra (MindTap Course List)AlgebraISBN:9781305652231Author:R. David Gustafson, Jeff HughesPublisher:Cengage Learning