
Elementary Statistics: Picturing the World (7th Edition)
7th Edition
ISBN: 9780134683416
Author: Ron Larson, Betsy Farber
Publisher: PEARSON
expand_more
expand_more
format_list_bulleted
Concept explainers
Videos
Textbook Question
Chapter 10, Problem 10.2.7RE
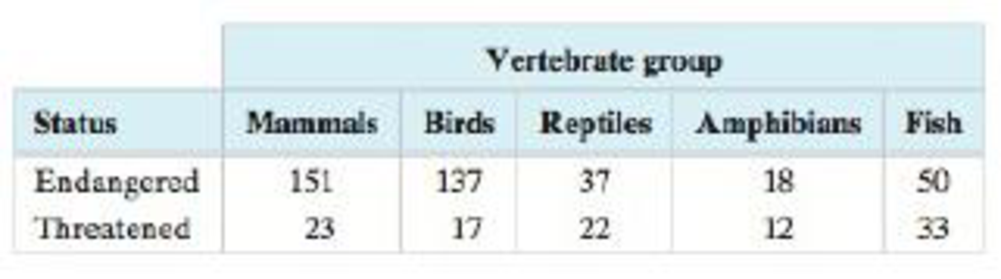
In Exercises 5−8, (a) find the expected frequency for each cell in the contingency table, (b) identify the claim and state Ho and Ha (c) determine the degrees of freedom, find the critical value, and identify the rejection region, (d) find the chi-square test statistic, (e) decide whether to reject or fail to reject the null hypothesis, and (f) interpret the decision in the context of the original claim.
7. The contingency table shows the results of a random sample of endangered and threatened species by status and vertebrate group. At α = 0.05, test the hypothesis that the variables are independent. (Adapted from U.S. Fish and Wildlife Service)
Expert Solution & Answer
Want to see the full answer?
Check out a sample textbook solution
Students have asked these similar questions
In Exercises 5–20, conduct the hypothesis test and provide the test statistic and the P-value and/or critical value, and state the conclusion.
Mendelian Genetics Experiments are conducted with hybrids of two types of peas. If the offspring follow Mendel’s theory of inheritance, the seeds that are produced are yellow smooth, green smooth, yellow wrinkled, and green wrinkled, and they should occur in the ratio of 9:3:3:1, respectively. An experiment is designed to test Mendel’s theory, with the result that the offspring seeds consist of 307 that are yellow smooth, 77 that are green smooth, 98 that are yellow wrinkled, and 18 that are green wrinkled. Use a 0.05 significance level to test the claim that the results contradict Mendel’s theory.
In Exercises 5–20, conduct the hypothesis test and provide the test statistic and the P-value and/or critical value, and state the conclusion.
Police Calls Repeat Exercise 11 using these observed frequencies for police calls received during the month of March: Monday (208); Tuesday (224); Wednesday (246); Thursday (173); Friday (210); Saturday (236); Sunday (154). What is a fundamental error with this analysis?
In Exercises 9–16, (a) write the claim mathematically andidentify and (b) find the critical value(s) and identify the rejectionregion(s), (c) find the standardized test statistic z, (d) decide whether to reject orfail to reject the null hypothesis, and (e) interpret the decision in the context of theoriginal claim. If convenient, use technology to find the standardized test statistic.
A research center claims that at least 40% of U.S. adults think the Census count is accurate. In a random sample of 600 U.S. adults, 35% say that the Census count is accurate. At ⍶ = 0.02 is there enough evidence to reject the center’s claim?
Chapter 10 Solutions
Elementary Statistics: Picturing the World (7th Edition)
Ch. 10.1 - The tax preparation company in Example 1 decides...Ch. 10.1 - Prob. 2TYCh. 10.1 - Prob. 3TYCh. 10.1 - What is a multinomial experiment?Ch. 10.1 - What conditions are necessary to use the...Ch. 10.1 - Finding Expected Frequencies In Exercises 36, find...Ch. 10.1 - Finding Expected Frequencies In Exercises 36, find...Ch. 10.1 - Finding Expected Frequencies In Exercises 36, find...Ch. 10.1 - Finding Expected Frequencies In Exercises 36, find...Ch. 10.1 - Using and Interpreting Concepts Performing a...
Ch. 10.1 - Coffee A researcher claims that the numbers of...Ch. 10.1 - Performing a Chi-Square Goodness-of-Fit Test In...Ch. 10.1 - Performing a Chi-Square Goodness-of-Fit Test In...Ch. 10.1 - Performing a Chi-Square Goodness-of-Fit Test In...Ch. 10.1 - Performing a Chi-Square Goodness-of-Fit Test In...Ch. 10.1 - Performing a Chi-Square Goodness-of-Fit Test In...Ch. 10.1 - Performing a Chi-Square Goodness-of-Fit Test In...Ch. 10.1 - Performing a Chi-Square Goodness-of-Fit Test In...Ch. 10.1 - Performing a Chi-Square Goodness-of-Fit Test In...Ch. 10.1 - In Exercises 17 and 18, (a) find the expected...Ch. 10.1 - In Exercises 17 and 18, (a) find the expected...Ch. 10.2 - The marketing consultant for a travel agency wants...Ch. 10.2 - Prob. 2TYCh. 10.2 - Prob. 3TYCh. 10.2 - Prob. 1ECh. 10.2 - Explain the difference between marginal...Ch. 10.2 - Prob. 3ECh. 10.2 - Prob. 4ECh. 10.2 - Prob. 5ECh. 10.2 - True or False? In Exercises 5 and 6, determine...Ch. 10.2 - Finding Expected Frequencies In Exercises 712, (a)...Ch. 10.2 - Finding Expected Frequencies In Exercises 712, (a)...Ch. 10.2 - Prob. 9ECh. 10.2 - Prob. 10ECh. 10.2 - Prob. 11ECh. 10.2 - Prob. 12ECh. 10.2 - Performing a Chi-Square Independence Test In...Ch. 10.2 - Prob. 14ECh. 10.2 - Performing a Chi-Square Independence Test In...Ch. 10.2 - Performing a Chi-Square Independence Test In...Ch. 10.2 - Performing a Chi-Square Independence Test In...Ch. 10.2 - Performing a Chi-Square Independence Test In...Ch. 10.2 - Prob. 19ECh. 10.2 - Performing a Chi-Square Independence Test In...Ch. 10.2 - Prob. 21ECh. 10.2 - Performing a Chi-Square Independence Test In...Ch. 10.2 - Performing a Chi-Square Independence Test In...Ch. 10.2 - Prob. 24ECh. 10.2 - Prob. 25ECh. 10.2 - Prob. 26ECh. 10.2 - Prob. 27ECh. 10.2 - Prob. 28ECh. 10.2 - Motor Vehicle Crash Deaths The contingency table...Ch. 10.2 - Prob. 30ECh. 10.2 - Prob. 31ECh. 10.2 - Prob. 32ECh. 10.2 - Prob. 33ECh. 10.2 - Prob. 34ECh. 10.2 - Prob. 35ECh. 10.2 - Contingency Tables and Relative Frequencies In...Ch. 10.2 - Prob. 37ECh. 10.2 - Prob. 38ECh. 10.2 - Prob. 39ECh. 10.2 - Conditional Relative Frequencies In Exercises...Ch. 10.2 - Conditional Relative Frequencies In Exercises...Ch. 10.2 - Prob. 42ECh. 10.2 - In your opinion, how safe is the food you buy? CBS...Ch. 10.2 - In your opinion, how safe is the food you buy? CBS...Ch. 10.2 - In your opinion, how safe is the food you buy? CBS...Ch. 10.2 - In your opinion, how safe is the food you buy? CBS...Ch. 10.2 - In your opinion, how safe is the food you buy? CBS...Ch. 10.2 - In your opinion, how safe is the food you buy? CBS...Ch. 10.3 - Find the critical F-value for a right-tailed test...Ch. 10.3 - Prob. 2TYCh. 10.3 - Prob. 3TYCh. 10.3 - Prob. 4TYCh. 10.3 - Explain how to find the critical value for an...Ch. 10.3 - List five properties of the F-distribution.Ch. 10.3 - List the three conditions that must be met in...Ch. 10.3 - Explain how to determine the values of d.f.N and...Ch. 10.3 - Prob. 5ECh. 10.3 - Prob. 6ECh. 10.3 - Prob. 7ECh. 10.3 - Finding a Critical F-Value for a Right-Tailed Test...Ch. 10.3 - Prob. 9ECh. 10.3 - Finding a Critical F-Value for a Right-Tailed Test...Ch. 10.3 - Finding a Critical F-Value for a Right-Tailed Test...Ch. 10.3 - Finding a Critical F-Value for a Right-Tailed Test...Ch. 10.3 - In Exercises 1318, test the claim about the...Ch. 10.3 - In Exercises 1318, test the claim about the...Ch. 10.3 - Prob. 15ECh. 10.3 - Prob. 16ECh. 10.3 - Prob. 17ECh. 10.3 - In Exercises 1318, test the claim about the...Ch. 10.3 - Performing a Two-Sample F-Test In Exercises 1926,...Ch. 10.3 - Prob. 20ECh. 10.3 - Performing a Two-Sample F-Test In Exercises 1926,...Ch. 10.3 - Performing a Two-Sample F-Test In Exercises 1926,...Ch. 10.3 - Performing a Two-Sample F-Test In Exercises 1926,...Ch. 10.3 - Prob. 24ECh. 10.3 - Prob. 25ECh. 10.3 - Performing a Two-Sample F-Test In Exercises 1926,...Ch. 10.3 - Prob. 27ECh. 10.3 - In Exercises 27 and 28, find the right- and...Ch. 10.3 - In Exercises 29 and 30, construct the confidence...Ch. 10.3 - In Exercises 29 and 30, construct the confidence...Ch. 10.4 - A sales analyst wants to determine whether there...Ch. 10.4 - Prob. 2TYCh. 10.4 - Slate the null and alternative hypotheses for a...Ch. 10.4 - What conditions are necessary in order to use a...Ch. 10.4 - Describe the difference between the variance...Ch. 10.4 - Prob. 4ECh. 10.4 - Performing a One-Way ANOVA Test In Exercises 514,...Ch. 10.4 - Performing a One-Way ANOVA Test In Exercises 514,...Ch. 10.4 - Performing a One-Way ANOVA Test In Exercises 514,...Ch. 10.4 - Prob. 8ECh. 10.4 - Prob. 9ECh. 10.4 - Performing a One-Way ANOVA Test In Exercises 514,...Ch. 10.4 - Performing a One-Way ANOVA Test In Exercises 514,...Ch. 10.4 - Prob. 12ECh. 10.4 - Performing a One-Way ANOVA Test In Exercises 514,...Ch. 10.4 - Performing a One-Way ANOVA Test In Exercises 514,...Ch. 10.4 - Prob. 15ECh. 10.4 - Prob. 16ECh. 10.4 - Prob. 17ECh. 10.4 - Prob. 18ECh. 10.4 - The Scheff Test If the null hypothesis is rejected...Ch. 10.4 - Prob. 20ECh. 10.4 - Prob. 21ECh. 10.4 - Prob. 22ECh. 10 - In Exercises 14. (a) identify the claim and state...Ch. 10 - In Exercises 14. (a) identify the claim and state...Ch. 10 - In Exercises 14, (a) identify the claim and state...Ch. 10 - Prob. 10.1.4RECh. 10 - Prob. 10.2.5RECh. 10 - In Exercises 58, (a) find the expected frequency...Ch. 10 - In Exercises 58, (a) find the expected frequency...Ch. 10 - In Exercises 58, (a) find the expected frequency...Ch. 10 - Prob. 10.3.9RECh. 10 - Prob. 10.3.10RECh. 10 - Prob. 10.3.11RECh. 10 - Prob. 10.3.12RECh. 10 - Prob. 10.3.13RECh. 10 - Prob. 10.3.14RECh. 10 - Prob. 10.3.15RECh. 10 - Prob. 10.3.16RECh. 10 - Prob. 10.3.17RECh. 10 - Prob. 10.3.18RECh. 10 - Prob. 10.3.19RECh. 10 - Prob. 10.3.20RECh. 10 - Prob. 10.4.21RECh. 10 - In Exercises 21 and 22, (a) identify the claim and...Ch. 10 - Prob. 1CQCh. 10 - Prob. 2CQCh. 10 - Take this quiz as you would take a quiz in class....Ch. 10 - Prob. 4CQCh. 10 - In each exercise, (a) identify the claim and state...Ch. 10 - Prob. 2CTCh. 10 - In each exercise, (a) identify the claim and state...Ch. 10 - Prob. 4CTCh. 10 - Prob. 5CTCh. 10 - Prob. 6CTCh. 10 - Goodness-of-Fit The table at the right shows an...Ch. 10 - Independence The contingency table below shows the...Ch. 10 - Prob. 1TCh. 10 - Prob. 2TCh. 10 - Prob. 3TCh. 10 - Teacher Salaries The Illinois State Board of...Ch. 10 - Repeat Exercises 14 using the data in the table...Ch. 10 - The table below shows the winning times (in...Ch. 10 - Prob. 2CRCh. 10 - The equation used to predict the annual sweet...Ch. 10 - Prob. 4CRCh. 10 - Prob. 5CRCh. 10 - Reviewing a Movie The contingency table shows how...Ch. 10 - Prob. 7CR
Knowledge Booster


Learn more about
Need a deep-dive on the concept behind this application? Look no further. Learn more about this topic, statistics and related others by exploring similar questions and additional content below.Similar questions
- An organization published an article stating that in any one-year period, approximately 7.5 percent of adults in a country suffer from depression or a depressive illness. Suppose that in a survey of 100 people in a certain town, six of them suffered from depression or a depressive illness. Conduct a hypothesis test to determine if the true proportion of people in that town suffering from depression or a depressive illness is lower than the percent in the general adult population in the country.arrow_forwardThe contingency table shows how a random sample of college freshmen graded the leaders of three types of institutions. α=0.05, Institution A B C D/FMilitary 23 47 15 23Religious 21 42 28 19Media / Press 18 24 39 24 The claim is ? What are the degrees of freedom? d.f = What is the critical value? What is the test statistic? Should I reject or fail to reject the null hypothesis? What is the correct rejection region?arrow_forwardA company manager wants to compare the satisfaction levels of his customers from two stores belonging to his company. According to his research, 249 out of 300 people are satisfied with shop A, and 348 out of 400 people are satisfied with shop B. Which of the following hypothesis states that there is a significant difference between customer satisfaction levels? H0 : P1 < P2, H1 : P1 ≥ P2 H0 : P1 ≥ P2, H1 : P1 < P2 H0 : P1 > P2, H1 : P1 < P2 H0 : P1 = P2, H1 : P1 ≠ P2 H0 : P1 ≠ P2, H1 : P1 < P2arrow_forward
- 4. The National Institute of Mental Health published an article stating that in any one-year period, approximately 9.5 percent of American adults suffer from depression or a depressive illness. Suppose that in a survey of 100 people in a certain town, seven of them suffered from depression or a depressive illness. Conduct a hypothesis test to determine if the true proportion of people in that town suffering from depression or a depressive illness is lower than the percent in the general adult American population.arrow_forwardThe National Institute of Mental Health published an article stating that in any two-year period, approximately 10.5percent of American adults suffer from depression or a depressive illness. Suppose that in a survey of 150 people in a certain town, eight of them suffered from depression or a depressive illness. If you were conducting a hypothesis test to determine if the true proportion of people in that town suffering from depression or a depressive illness is lower than the percent in the general adult American population, what would the null and alternative hypotheses be?arrow_forwardEconomists believe that 13.5% of potential home buyers will stop shopping for a house when interest rate rises. A real estate agent randomly surveyed 710 house shoppers in her region and learned that 121 plan to stop shopping. a. Complete the hypothesis test at 0.01 level of significance, using the critical value method: H0: p = 13.5% H1: p ≠ 13.5% b. What are the assumptions (or requirements) for this procedure? c. Estimate the probability: P (0.102<p<0.168) Show all relevant information, including sample calculations, degree of freedom (if any), critical values, test statistic, etc.arrow_forward
- Derive the conditional likelihood under m:1 matching where the model includes only treatment as a covariate.arrow_forward. The National Institute of Mental Health published an article stating that in any one-year period, approximately 9.5 percent of American adults suffer from depression or a depressive illness. Suppose that in a survey of 100 people in a certain town, seven of them suffered from depression or a depressive illness. If you were conducting a hypothesis test to determine if the true proportion of people in that town suffering from depression or a depressive illness is lower than the percent in the general adult American population, what would the null and alternative hypotheses be?arrow_forwardExercise 1.5 introduces a study where researchers studying the rela- tionship between honesty, age, and self-control conducted an experiment on 160 children between the ages of 5 and 15. The researchers asked each child to toss a fair coin in private and to record the outcome (white or black) on a paper sheet, and said they would only reward children who report white. Half the students were explicitly told not to cheat and the others were not given any explicit instructions. Differences were observed in the cheating rates in the instruction and no instruction groups, as well as some differences across children’s characteristics within each group. (a) Identify the population of interest and the sample in this study. (b) Comment on whether or not the results of the study can be generalized to the population, and if the findings of the study can be used to establish causal relationships.arrow_forward
- In Exercises 11 –14, test the claim about the difference between two population means u1 and u2 at the level of significance a. Assume the samples are random and independent, and the populations are normally distributed.arrow_forwardA psychologist develops an intervention designed to reduce test anxiety associated with taking the SAT. The psychologist claims that reduced test anxiety will lead to higher scores on the quantitative section of the SAT. Because she believes all students experience some degree of anxiety related to the SAT, she further claims her intervention should work for all students, not just those who report abnormal levels of test anxiety. She randomly selects 30 high school juniors, and with the consent of their parents, delivers her intervention. Subsequently, these students take the SAT, and she collects their scores. The quantitative section of the SAT has a mean of 500 and a standard deviation of 100 in the general population, and scores are normally distributed. a. What type of test should be used to analyze her data? i. Z-test ii. Single-sample t-test iii. Independent-measures t-test iv. Repeated-measures t-test b. What would the hypotheses be?arrow_forwardThe contingency table shows the results of a random sample of adults who watch movies on Netflix. At , can you conclude that the type of movie watched is independent of the age of the adult? Age Type of Movie Watched 18-24 25-34 35-44 45-64 65 + Comedy 38 30 24 10 8 Action 15 17 16 9 5 Drama 12 11 19 25 13 1. State the hypotheses. 2. Calculate the test statistic. 3. Calculate the p-value. 4. Decision: Reject H0 or Fail to Reject H0 5. Conclusion:arrow_forward
arrow_back_ios
SEE MORE QUESTIONS
arrow_forward_ios
Recommended textbooks for you
 MATLAB: An Introduction with ApplicationsStatisticsISBN:9781119256830Author:Amos GilatPublisher:John Wiley & Sons Inc
 Probability and Statistics for Engineering and th...StatisticsISBN:9781305251809Author:Jay L. DevorePublisher:Cengage Learning
 Statistics for The Behavioral Sciences (MindTap C...StatisticsISBN:9781305504912Author:Frederick J Gravetter, Larry B. WallnauPublisher:Cengage Learning
 Elementary Statistics: Picturing the World (7th E...StatisticsISBN:9780134683416Author:Ron Larson, Betsy FarberPublisher:PEARSON
 The Basic Practice of StatisticsStatisticsISBN:9781319042578Author:David S. Moore, William I. Notz, Michael A. FlignerPublisher:W. H. Freeman
 Introduction to the Practice of StatisticsStatisticsISBN:9781319013387Author:David S. Moore, George P. McCabe, Bruce A. CraigPublisher:W. H. Freeman
MATLAB: An Introduction with Applications
Statistics
ISBN:9781119256830
Author:Amos Gilat
Publisher:John Wiley & Sons Inc
Probability and Statistics for Engineering and th...
Statistics
ISBN:9781305251809
Author:Jay L. Devore
Publisher:Cengage Learning
Statistics for The Behavioral Sciences (MindTap C...
Statistics
ISBN:9781305504912
Author:Frederick J Gravetter, Larry B. Wallnau
Publisher:Cengage Learning
Elementary Statistics: Picturing the World (7th E...
Statistics
ISBN:9780134683416
Author:Ron Larson, Betsy Farber
Publisher:PEARSON
The Basic Practice of Statistics
Statistics
ISBN:9781319042578
Author:David S. Moore, William I. Notz, Michael A. Fligner
Publisher:W. H. Freeman
Introduction to the Practice of Statistics
Statistics
ISBN:9781319013387
Author:David S. Moore, George P. McCabe, Bruce A. Craig
Publisher:W. H. Freeman
Hypothesis Testing - Solving Problems With Proportions; Author: The Organic Chemistry Tutor;https://www.youtube.com/watch?v=76VruarGn2Q;License: Standard YouTube License, CC-BY
Hypothesis Testing and Confidence Intervals (FRM Part 1 – Book 2 – Chapter 5); Author: Analystprep;https://www.youtube.com/watch?v=vth3yZIUlGQ;License: Standard YouTube License, CC-BY