
Elementary Statistics: Picturing the World (7th Edition)
7th Edition
ISBN: 9780134683416
Author: Ron Larson, Betsy Farber
Publisher: PEARSON
expand_more
expand_more
format_list_bulleted
Videos
Textbook Question
Chapter 10.1, Problem 8E
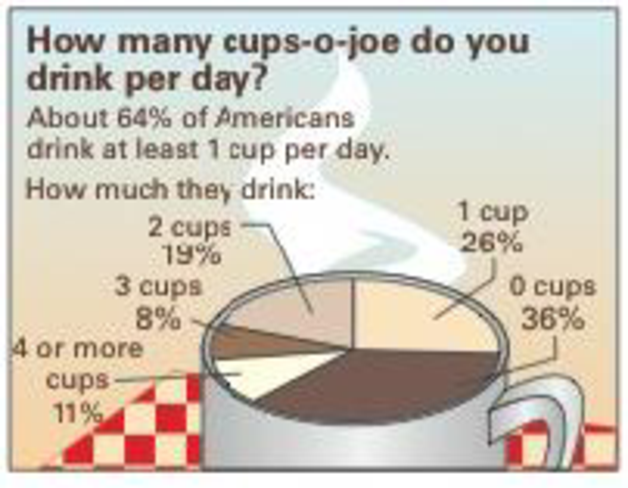
Coffee A researcher claims that the numbers of cups of coffee U.S. adults drink per day are distributed as shown in the figure. You randomly select 1600 U.S. adults and ask them how many cups of coffee they drink per day. The table shows the results. At α = 0.05, test the researcher’s claim. (Source Gallup)
| Survey results | |
| Response | Frequency, f |
| 0 cups | 570 |
| 1 cup | 432 |
| 2 cups | 282 |
| 3 cups | 152 |
| 4 or more cups | 164 |
Expert Solution & Answer
Want to see the full answer?
Check out a sample textbook solution
Chapter 10 Solutions
Elementary Statistics: Picturing the World (7th Edition)
Ch. 10.1 - The tax preparation company in Example 1 decides...Ch. 10.1 - Prob. 2TYCh. 10.1 - Prob. 3TYCh. 10.1 - What is a multinomial experiment?Ch. 10.1 - What conditions are necessary to use the...Ch. 10.1 - Finding Expected Frequencies In Exercises 36, find...Ch. 10.1 - Finding Expected Frequencies In Exercises 36, find...Ch. 10.1 - Finding Expected Frequencies In Exercises 36, find...Ch. 10.1 - Finding Expected Frequencies In Exercises 36, find...Ch. 10.1 - Using and Interpreting Concepts Performing a...
Ch. 10.1 - Coffee A researcher claims that the numbers of...Ch. 10.1 - Performing a Chi-Square Goodness-of-Fit Test In...Ch. 10.1 - Performing a Chi-Square Goodness-of-Fit Test In...Ch. 10.1 - Performing a Chi-Square Goodness-of-Fit Test In...Ch. 10.1 - Performing a Chi-Square Goodness-of-Fit Test In...Ch. 10.1 - Performing a Chi-Square Goodness-of-Fit Test In...Ch. 10.1 - Performing a Chi-Square Goodness-of-Fit Test In...Ch. 10.1 - Performing a Chi-Square Goodness-of-Fit Test In...Ch. 10.1 - Performing a Chi-Square Goodness-of-Fit Test In...Ch. 10.1 - In Exercises 17 and 18, (a) find the expected...Ch. 10.1 - In Exercises 17 and 18, (a) find the expected...Ch. 10.2 - The marketing consultant for a travel agency wants...Ch. 10.2 - Prob. 2TYCh. 10.2 - Prob. 3TYCh. 10.2 - Prob. 1ECh. 10.2 - Explain the difference between marginal...Ch. 10.2 - Prob. 3ECh. 10.2 - Prob. 4ECh. 10.2 - Prob. 5ECh. 10.2 - True or False? In Exercises 5 and 6, determine...Ch. 10.2 - Finding Expected Frequencies In Exercises 712, (a)...Ch. 10.2 - Finding Expected Frequencies In Exercises 712, (a)...Ch. 10.2 - Prob. 9ECh. 10.2 - Prob. 10ECh. 10.2 - Prob. 11ECh. 10.2 - Prob. 12ECh. 10.2 - Performing a Chi-Square Independence Test In...Ch. 10.2 - Prob. 14ECh. 10.2 - Performing a Chi-Square Independence Test In...Ch. 10.2 - Performing a Chi-Square Independence Test In...Ch. 10.2 - Performing a Chi-Square Independence Test In...Ch. 10.2 - Performing a Chi-Square Independence Test In...Ch. 10.2 - Prob. 19ECh. 10.2 - Performing a Chi-Square Independence Test In...Ch. 10.2 - Prob. 21ECh. 10.2 - Performing a Chi-Square Independence Test In...Ch. 10.2 - Performing a Chi-Square Independence Test In...Ch. 10.2 - Prob. 24ECh. 10.2 - Prob. 25ECh. 10.2 - Prob. 26ECh. 10.2 - Prob. 27ECh. 10.2 - Prob. 28ECh. 10.2 - Motor Vehicle Crash Deaths The contingency table...Ch. 10.2 - Prob. 30ECh. 10.2 - Prob. 31ECh. 10.2 - Prob. 32ECh. 10.2 - Prob. 33ECh. 10.2 - Prob. 34ECh. 10.2 - Prob. 35ECh. 10.2 - Contingency Tables and Relative Frequencies In...Ch. 10.2 - Prob. 37ECh. 10.2 - Prob. 38ECh. 10.2 - Prob. 39ECh. 10.2 - Conditional Relative Frequencies In Exercises...Ch. 10.2 - Conditional Relative Frequencies In Exercises...Ch. 10.2 - Prob. 42ECh. 10.2 - In your opinion, how safe is the food you buy? CBS...Ch. 10.2 - In your opinion, how safe is the food you buy? CBS...Ch. 10.2 - In your opinion, how safe is the food you buy? CBS...Ch. 10.2 - In your opinion, how safe is the food you buy? CBS...Ch. 10.2 - In your opinion, how safe is the food you buy? CBS...Ch. 10.2 - In your opinion, how safe is the food you buy? CBS...Ch. 10.3 - Find the critical F-value for a right-tailed test...Ch. 10.3 - Prob. 2TYCh. 10.3 - Prob. 3TYCh. 10.3 - Prob. 4TYCh. 10.3 - Explain how to find the critical value for an...Ch. 10.3 - List five properties of the F-distribution.Ch. 10.3 - List the three conditions that must be met in...Ch. 10.3 - Explain how to determine the values of d.f.N and...Ch. 10.3 - Prob. 5ECh. 10.3 - Prob. 6ECh. 10.3 - Prob. 7ECh. 10.3 - Finding a Critical F-Value for a Right-Tailed Test...Ch. 10.3 - Prob. 9ECh. 10.3 - Finding a Critical F-Value for a Right-Tailed Test...Ch. 10.3 - Finding a Critical F-Value for a Right-Tailed Test...Ch. 10.3 - Finding a Critical F-Value for a Right-Tailed Test...Ch. 10.3 - In Exercises 1318, test the claim about the...Ch. 10.3 - In Exercises 1318, test the claim about the...Ch. 10.3 - Prob. 15ECh. 10.3 - Prob. 16ECh. 10.3 - Prob. 17ECh. 10.3 - In Exercises 1318, test the claim about the...Ch. 10.3 - Performing a Two-Sample F-Test In Exercises 1926,...Ch. 10.3 - Prob. 20ECh. 10.3 - Performing a Two-Sample F-Test In Exercises 1926,...Ch. 10.3 - Performing a Two-Sample F-Test In Exercises 1926,...Ch. 10.3 - Performing a Two-Sample F-Test In Exercises 1926,...Ch. 10.3 - Prob. 24ECh. 10.3 - Prob. 25ECh. 10.3 - Performing a Two-Sample F-Test In Exercises 1926,...Ch. 10.3 - Prob. 27ECh. 10.3 - In Exercises 27 and 28, find the right- and...Ch. 10.3 - In Exercises 29 and 30, construct the confidence...Ch. 10.3 - In Exercises 29 and 30, construct the confidence...Ch. 10.4 - A sales analyst wants to determine whether there...Ch. 10.4 - Prob. 2TYCh. 10.4 - Slate the null and alternative hypotheses for a...Ch. 10.4 - What conditions are necessary in order to use a...Ch. 10.4 - Describe the difference between the variance...Ch. 10.4 - Prob. 4ECh. 10.4 - Performing a One-Way ANOVA Test In Exercises 514,...Ch. 10.4 - Performing a One-Way ANOVA Test In Exercises 514,...Ch. 10.4 - Performing a One-Way ANOVA Test In Exercises 514,...Ch. 10.4 - Prob. 8ECh. 10.4 - Prob. 9ECh. 10.4 - Performing a One-Way ANOVA Test In Exercises 514,...Ch. 10.4 - Performing a One-Way ANOVA Test In Exercises 514,...Ch. 10.4 - Prob. 12ECh. 10.4 - Performing a One-Way ANOVA Test In Exercises 514,...Ch. 10.4 - Performing a One-Way ANOVA Test In Exercises 514,...Ch. 10.4 - Prob. 15ECh. 10.4 - Prob. 16ECh. 10.4 - Prob. 17ECh. 10.4 - Prob. 18ECh. 10.4 - The Scheff Test If the null hypothesis is rejected...Ch. 10.4 - Prob. 20ECh. 10.4 - Prob. 21ECh. 10.4 - Prob. 22ECh. 10 - In Exercises 14. (a) identify the claim and state...Ch. 10 - In Exercises 14. (a) identify the claim and state...Ch. 10 - In Exercises 14, (a) identify the claim and state...Ch. 10 - Prob. 10.1.4RECh. 10 - Prob. 10.2.5RECh. 10 - In Exercises 58, (a) find the expected frequency...Ch. 10 - In Exercises 58, (a) find the expected frequency...Ch. 10 - In Exercises 58, (a) find the expected frequency...Ch. 10 - Prob. 10.3.9RECh. 10 - Prob. 10.3.10RECh. 10 - Prob. 10.3.11RECh. 10 - Prob. 10.3.12RECh. 10 - Prob. 10.3.13RECh. 10 - Prob. 10.3.14RECh. 10 - Prob. 10.3.15RECh. 10 - Prob. 10.3.16RECh. 10 - Prob. 10.3.17RECh. 10 - Prob. 10.3.18RECh. 10 - Prob. 10.3.19RECh. 10 - Prob. 10.3.20RECh. 10 - Prob. 10.4.21RECh. 10 - In Exercises 21 and 22, (a) identify the claim and...Ch. 10 - Prob. 1CQCh. 10 - Prob. 2CQCh. 10 - Take this quiz as you would take a quiz in class....Ch. 10 - Prob. 4CQCh. 10 - In each exercise, (a) identify the claim and state...Ch. 10 - Prob. 2CTCh. 10 - In each exercise, (a) identify the claim and state...Ch. 10 - Prob. 4CTCh. 10 - Prob. 5CTCh. 10 - Prob. 6CTCh. 10 - Goodness-of-Fit The table at the right shows an...Ch. 10 - Independence The contingency table below shows the...Ch. 10 - Prob. 1TCh. 10 - Prob. 2TCh. 10 - Prob. 3TCh. 10 - Teacher Salaries The Illinois State Board of...Ch. 10 - Repeat Exercises 14 using the data in the table...Ch. 10 - The table below shows the winning times (in...Ch. 10 - Prob. 2CRCh. 10 - The equation used to predict the annual sweet...Ch. 10 - Prob. 4CRCh. 10 - Prob. 5CRCh. 10 - Reviewing a Movie The contingency table shows how...Ch. 10 - Prob. 7CR
Knowledge Booster


Learn more about
Need a deep-dive on the concept behind this application? Look no further. Learn more about this topic, statistics and related others by exploring similar questions and additional content below.Similar questions
- Stopping distance, The stopping distance of an automobile is the distance travelled during the driver’s reaction time plus the distance travelled after the driver applies the brakes. In an experiment, researchers measured these distances (in feet) when the automobile was traveling at a speed of x. miles per hour on dry, level pavement, as shown in the bar graph. The distance travelled during the reaction time R was R=1.1x and the braking distance B was B=0.0475x20.001x+0.23. (a) Determine the polynomial that represents the total stopping distance T. (b) Use the result of part (a) to estimate the total stopping distance when x=30,x=40, andx=55 miles per hour. (c) Use the bar graph to make a statement about the total stopping distance required forincreasing speeds.arrow_forwardVoting-Age Population The total voting-age population P (in millions) in the United States from 1990 through 2014 can be modeled by P=184.64+0.7524t21+0.0028t2,0t24 where t represents the year, with t=0 corresponding to 1990. (a) In which year did the total voting-age population reach 210 million? (b) Use the model to predict when the total voting-age population will reach 260 million. Is this prediction reasonable? Explain.arrow_forwardPopulation The population P (in millions) of Italy from 2003 through 2015 can be approximated by the model P=57.59e0.0051t, where t represents the year, with t=3 corresponding to 2003. (a) According to the model, is the population of Italy increasing or decreasing? Explain. (b) Find the populations of Italy in 2003 and 2015. (c) Use the model to predict the populations of Italy in 2020 and 2025.arrow_forward
- Stock Turnover at Retail In retail sales, an important marker of retail activity is the stock turnover at retail. This figure is calculated for a specific period of time as the total net sales divided by the retail value of the average stock during that time, where both are measured in dollars. As a formula, this is written Stockturnover=NetsalesAveragestockatretail. This formula expresses stock turnover as a function of net sales and average stock at retail. a. Suppose that your store had net sales of 682, 000 in mens shoes over the past six months and that the retail value of the average stock of mens shoes was 163, 000. What was the stock turnover at retail for that time period? b. Suppose that in a certain month, your stores net sales of womens dresses were 83, 000 and that the usual stock turnover at retail is 0.8 per month. What do you estimate to be your stores average stock at retail? c. Solve the equation for average stock at retail- that is, write a formula giving average stock at retail as a function of stock turnover and net sales. d. Suppose that in a certain time period, your store had an average stock of socks with a retail value of 45, 000 and a stock turnover at retail of 1.6. What were the stores net sales of socks during that time period? e. Solve the equation for net sales- that is, write a formula giving net sales as a function of stock turnover and average stock at retail.arrow_forwardPopulation The population P (in millions) of Italy from 2003 through 2015 can be approximated by the model P=57.59e0.0051t, where t represents the year, with t=3 corresponding to 2003. (Source: U.S. Census Bureau) (a) According to the model, is the population of Italy increasing or decreasing? Explain. (b) Find the populations of Italy in 2003 and 2015. (c) Use the model to predict the populations of Italy in 2020 and 2025.arrow_forward
arrow_back_ios
arrow_forward_ios
Recommended textbooks for you
 Algebra & Trigonometry with Analytic GeometryAlgebraISBN:9781133382119Author:SwokowskiPublisher:Cengage
 Functions and Change: A Modeling Approach to Coll...AlgebraISBN:9781337111348Author:Bruce Crauder, Benny Evans, Alan NoellPublisher:Cengage Learning
 Trigonometry (MindTap Course List)TrigonometryISBN:9781337278461Author:Ron LarsonPublisher:Cengage Learning
 Algebra and Trigonometry (MindTap Course List)AlgebraISBN:9781305071742Author:James Stewart, Lothar Redlin, Saleem WatsonPublisher:Cengage Learning
Algebra & Trigonometry with Analytic Geometry
Algebra
ISBN:9781133382119
Author:Swokowski
Publisher:Cengage
Functions and Change: A Modeling Approach to Coll...
Algebra
ISBN:9781337111348
Author:Bruce Crauder, Benny Evans, Alan Noell
Publisher:Cengage Learning
Trigonometry (MindTap Course List)
Trigonometry
ISBN:9781337278461
Author:Ron Larson
Publisher:Cengage Learning
Algebra and Trigonometry (MindTap Course List)
Algebra
ISBN:9781305071742
Author:James Stewart, Lothar Redlin, Saleem Watson
Publisher:Cengage Learning
what is Research Design, Research Design Types, and Research Design Methods; Author: Educational Hub;https://www.youtube.com/watch?v=LpmGSioXxdo;License: Standard YouTube License, CC-BY