Genetics: From Genes To Genomes (6th International Edition)
6th Edition
ISBN: 9781260041217
Author: Leland Hartwell Dr., ? Michael L. Goldberg Professor Dr., ? Janice Fischer, ? Leroy Hood Dr.
Publisher: Mcgraw-Hill
expand_more
expand_more
format_list_bulleted
Videos
Textbook Question
Chapter 11, Problem 25P
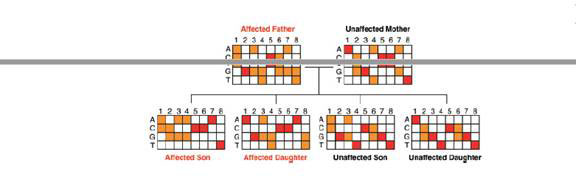
The following figure shows a partial microarray analysis for members of a nuclear family. The eight SNP loci examined are evenly spaced at about 10 Mb intervals on chromosome 4, and they are shown on the microarray in their actual order on this chromosome. For the time being, focus your attention only on the two parents and ignore whether they are affected or unaffected.
| a. | Write out the complete genotype for all the DNA markers in both parents. |
| b. | The microarray data indicate that one SNP locus has three alleles in this family. Which one? |
| c. | How would you know that these loci are in fact on chromosome 4 and are about 10 Mb apart? |
| d. | About what percentage of the total length of chromosome 4 is present in the region between DNA markers 1 and 8? (Chromosome 4 is 191 Mb long; it is the fourth largest in the human genome.) |
Expert Solution & Answer
Want to see the full answer?
Check out a sample textbook solution
Students have asked these similar questions
DNA of different densities is distinguished by a procedure called caesium chloride (CsCI) densitycentrifugation. Spinning CsCI at high speeds for many hours generates a gradient of caesium andchloride ions. The highest ion concentration, or density, occurs at the bottom of the tube.b. In this experiment, where on the cesium chloride (CsCI) gradient would the following DNAbe found (low density, middle density, or high density):Double stranded DNA where both strands are labeledDouble stranded DNA where one strand is labeledDouble stranded DNA where neither strand is labeled
From your knowledge about DNA microarray, answer the following:
A- How DNA microarray is created? and why it is referred to as “hybridization technology”?
B- Why RT-PCR is important in the sample preparation to perform expression microarray experiment?
C- Mention the name and the color of the dyes used in expression microarray?
D- If the expression microarray experiment was done with a normal sample and a suspected sample, after reading the color pattern resulted from the experiment it was recorded that “gene A22” is expressed in the suspected sample. The gene A22 is clinically linked to colon cancer. Answer the following: What is the expected color of the spot on the microarray which represents this gene? What is your interpretation of the suspected sample; is it a cancer sample or not and explain why?
As the leading scientist in a biomedical science laboratory, it is up to you to give advice to your lab assistants when they are having problems with their experiments. What advice would you give to your assistants that are having the following problems: After performing a polymerase chain reaction (PCR) and agarose gel electrophoresis to confirm the presence of the CO1 gene of 750bp.
a. They observe no band appearing on an agarose gel. What would be your conclusion?
b. They observe three bands of different sizes that resemble a smear on the gel. Advise.
a. They observe a single band on the gel and conclude that the PCR product is an exact copy of the original template DNA. Would you support their conclusion? Explain
Chapter 11 Solutions
Genetics: From Genes To Genomes (6th International Edition)
Ch. 11 - Choose the phrase from the right column that best...Ch. 11 - Would you characterize the pattern of inheritance...Ch. 11 - Would you be more likely to find single nucleotide...Ch. 11 - A recent estimate of the rate of base...Ch. 11 - If you examine Fig. 11.5 closely, you will note...Ch. 11 - Approximately 50 million SNPs have thus far been...Ch. 11 - Mutations at simple sequence repeat SSR loci occur...Ch. 11 - Humans and gorillas last shared a common ancestor...Ch. 11 - In 2015, an international team of scientists...Ch. 11 - Using PCR, you want to amplify an approximately 1...
Ch. 11 - Prob. 11PCh. 11 - The previous problem raises several interesting...Ch. 11 - You want to make a recombinant DNA in which a PCR...Ch. 11 - You sequence a PCR product amplified from a...Ch. 11 - Prob. 15PCh. 11 - The trinucleotide repeat region of the Huntington...Ch. 11 - Sperm samples were taken from two men just...Ch. 11 - Prob. 18PCh. 11 - a. It is possible to perform DNA fingerprinting...Ch. 11 - On July 17, 1918, Tsar Nicholas II; his wife the...Ch. 11 - The figure that follows shows DNA fingerprint...Ch. 11 - Microarrays were used to determine the genotypes...Ch. 11 - A partial sequence of the wild-type HbA allele is...Ch. 11 - a. In Fig. 11.17b, PCR is performed to amplify...Ch. 11 - The following figure shows a partial microarray...Ch. 11 - Scientists were surprised to discover recently...Ch. 11 - The microarray shown in Problem 25 analyzes...Ch. 11 - The figure that follows shows the pedigree of a...Ch. 11 - One of the difficulties faced by human geneticists...Ch. 11 - Now consider a mating between consanguineous...Ch. 11 - The pedigree shown in Fig. 11.22 was crucial to...Ch. 11 - You have identified a SNP marker that in one large...Ch. 11 - The pedigrees indicated here were obtained with...Ch. 11 - Approximately 3 of the population carries a mutant...Ch. 11 - The drug ivacaftor has recently been developed to...Ch. 11 - In the high-throughput DNA sequencing protocol...Ch. 11 - A researcher sequences the whole exome of a...Ch. 11 - As explained in the text, the cause of many...Ch. 11 - Figure 11.26 portrayed the analysis of Miller...Ch. 11 - A research paper published in the summer of 2012...Ch. 11 - Table 11.2 and Fig. 11.27 together portray the...Ch. 11 - The human RefSeq of the entire first exon of a...Ch. 11 - Mutations in the HPRT1 gene in humans result in at...Ch. 11 - Prob. 44P
Knowledge Booster


Learn more about
Need a deep-dive on the concept behind this application? Look no further. Learn more about this topic, biology and related others by exploring similar questions and additional content below.Similar questions
- If it is not possible to have three bands for one STR region when looking at the DNA from one individual, then how many different STR regions were sampled in the gel electrophoresis simulation to end up with the three bands on the gel. Note: there are several possible correct answers to this question.arrow_forwardAs the leading scientist in a biomedical science laboratory, it is a requirement to give advice to your lab assistants when they are having problems with their experiments. What advice would you give to your assistants that are having the following problems: After performing a polymerase chain reaction (PCR) and agarose gel electrophoresis to confirm the presence of the C01 gene of 750bp. 2.1. They observe no band appearing on an agarose gel. What would be your conclusion? 2.2. They observe three bands of different sizes that resemble a smear on the gel. Advice 2.3. They observe a single band on the gel and conclude that the PCR product is an exact copy of the original template DNA. Would you support their condusion? Explain. 2.4. Explain how PCR can be used to detect infectious agents in diagnoses of diseases.arrow_forwardMicrosatellites are currently exploited as markers for paternity testing. A sample paternity test is shown in the following table in which ten microsatellite markers were used to test samples from a mother, her child, and an alleged father. The name of the microsatellite locus is given in the left-hand column, and the genotype of each individual is recorded as the number of repeats he or she carries at that locus. For example, at locus D9S302, the mother carries 30 repeats on one of her chromosomes and 31 on the other. In cases where an individual carries the same number of repeats on both chromosomes, only a single number is recorded. (Some of the numbers are followed by a decimal point, for example, 20.2, to indicate a partial repeat in addition to the complete repeats.) Assuming that these markers are inherited in a simple Mendelian fashion, can the alleged father be excluded as the source of the sperm that produced the child? Why or why not? Explain. Microsatellite Locus-…arrow_forward
- Based on the electrophoresis experiment, 0.7% agarose gel concentration was used. If the gel concentration increased to 1%, what would happen to the DNA migration? Explain briefly.arrow_forwardHere is a DNA agarose gel showing PCR products from a mouse genotyping experiment. Genotyping tells us whether each mouse is a wild type mouse (i.e. not genetically modified) or a mutant mouse. Interpret the results for each mouse 1-3.arrow_forwardAre you a hidden heterozygote? A PCR analysis (part2) Agarose gel electrophoresis and interpretation la: Several factors (including agarose gel concentration, time and current) affect migration of DNA fragments through the agarose gel. Briefly explain how each of these factors affects DNA migration. Agarose gel concentration: Time: Voltage: 1b: Do DNA fragments move towards the positive or negative end of the gel box? Explain your answer. 1c: What is the purpose of the Tris-Acetate-EDTA (TAE) buffer that the agarose gel is prepared with and submerged in for running? What would happen if you used water to prepare and run the gel instead of TAE buffer? 1d: If the student is homozygous for the brown allele, how many bands will they see in the lanes for the blue and brown allele samples? (circle one) Brown sample: 0 Blue sample: 1 2 more than two. 1 2 more than two. le: If the student is homozygous for the blue allele, how many bands will they see in the lanes for the blue and brown allele…arrow_forward
- DNA from 100 unrelated individuals from one population of Chinook salmon were amplified at a single microsatellite locus, and run on an agarose gel. The results from gel electrophoresis shows three different fragment lengths (i.e. alleles/band positions) corresponding to 3 alleles; Allele F (250bp), Allele R (180bp), and Allele Y (100bp). The numbers at the top of each lane is the number of fish observed with that particular genotype or banding pattern in the population. Note that a single band means a homozygote for that allele (band size). a) Calculate the allele frequency for Allele Y. (b) Calculate the genotype frequencies for the following genotypes: FF, FR, and RY. (c) What is the expected number of Chinook salmon with homozygous genotype for allele Y in the study population? (d)What is the name of the statistical test that you could conduct to test whether this population of Chinook salmon is in Hardy Weinberg Equilibriumarrow_forwardCompared to the normal A allele, the disease-causing allele in sickle cell anemia (S allele) is missing an MstII restriction site. On a Southern blot of genomic DNA cut with MstII and hybridized with the probe shown on the diagram below, a person with sickle anemia, carrying two S alleles, will show Choose an answer below: a single band at 1.1 kb. a single band at 1.3 kb. a single band at 0.2 kb. one band at 0.2 and one at 1.3 kb. one band at 1.1 and one at 1.3 kb.arrow_forwardISSR is generally a dominant STS DNA marker. Nonetheless, with validated experimental evidence (e.g. laboratory and population genetics data), the marker can be used in codominance marker genotyping. Briefly explain each case below: a) Codominant marker targets specific locus and reveals allelic variations in that locus among DNA samples. b) Dominant marker: primers can complement other repeat sequences or in multiple loci thereby non-specificity in sampled genomes.arrow_forward
- With only one exception, the most commonly used STR loci are spread across the human genome,each on a separate chromosome.a. Why is it important to analyze STRs that are all on their own chromosomes?b. What is the exception to this? (i.e., which two loci are on the same human chromosomeand which chromosome are they on?)c. Using the UCSC Genome browser, look up the two loci that you answered in 2.b. one ata time. Include a rough hand-drawing or screenshot of the ideogram (pictograph,example below) of the chromosome and mark the approximate location of each locus.Example:d. Using your answer in 2.c. and your knowledge of the frequency of crossover events onhuman chromosomes (see chapters 5 and 6), in your opinion is the fact that these twoloci are on the same chromosome a problem for forensic genetic analysis? Explain youranswerarrow_forwardIn our simple model of DNA amplification we assumed that a successful amplification doubled the DNA each cycle. Reality isn't so kind! Two related problems encountered in DNA profiling are the issues of asymmetric peaks and "drop-out" where an allele produces a small to very-small peak compared to the other allele. Assume you have a sample with a heterozygous set of alleles. Let one of the alleles be successfully doubled each cycle but the second allele is (on average) only increased by 1.8. If the sample is subjected to 30 PCR cycles, how much larger will the "successful" peak be than the "less successful" peak? Set your answer up as a ratio of the "successful" /"unsuccessful" and round your number to 1 decimal place. (for example, if your calculations show that after 30 cycles the successful allele has 55340 copies and the unsuccessful has 10000 copies the ratio is 5.5)arrow_forwardAnswer the following: 1. Which pieces of DNA are the most informative? Why? 2. Explore the concept of "depth of coverage" (the number of fragments that cover a particular span of the contig). Where is the greatest depth of coverage? Where is the least depth of coverage? 3. What do the patterned bands represent? 4. Was it easier to assemble fragments that had multiple types of markers vs. just one type? Why? Assembling contigs out of DNA sequences (strings of As, Cs, Gs, and Ts) follows the same principle: instead of using markers, you line up fragments by overlapping DNA sequences.arrow_forward
arrow_back_ios
SEE MORE QUESTIONS
arrow_forward_ios
Recommended textbooks for you
 Human Anatomy & Physiology (11th Edition)BiologyISBN:9780134580999Author:Elaine N. Marieb, Katja N. HoehnPublisher:PEARSON
 Biology 2eBiologyISBN:9781947172517Author:Matthew Douglas, Jung Choi, Mary Ann ClarkPublisher:OpenStax
 Anatomy & PhysiologyBiologyISBN:9781259398629Author:McKinley, Michael P., O'loughlin, Valerie Dean, Bidle, Theresa StouterPublisher:Mcgraw Hill Education,
 Molecular Biology of the Cell (Sixth Edition)BiologyISBN:9780815344322Author:Bruce Alberts, Alexander D. Johnson, Julian Lewis, David Morgan, Martin Raff, Keith Roberts, Peter WalterPublisher:W. W. Norton & Company
 Laboratory Manual For Human Anatomy & PhysiologyBiologyISBN:9781260159363Author:Martin, Terry R., Prentice-craver, CynthiaPublisher:McGraw-Hill Publishing Co.
 Inquiry Into Life (16th Edition)BiologyISBN:9781260231700Author:Sylvia S. Mader, Michael WindelspechtPublisher:McGraw Hill Education
Human Anatomy & Physiology (11th Edition)
Biology
ISBN:9780134580999
Author:Elaine N. Marieb, Katja N. Hoehn
Publisher:PEARSON
Biology 2e
Biology
ISBN:9781947172517
Author:Matthew Douglas, Jung Choi, Mary Ann Clark
Publisher:OpenStax
Anatomy & Physiology
Biology
ISBN:9781259398629
Author:McKinley, Michael P., O'loughlin, Valerie Dean, Bidle, Theresa Stouter
Publisher:Mcgraw Hill Education,
Molecular Biology of the Cell (Sixth Edition)
Biology
ISBN:9780815344322
Author:Bruce Alberts, Alexander D. Johnson, Julian Lewis, David Morgan, Martin Raff, Keith Roberts, Peter Walter
Publisher:W. W. Norton & Company
Laboratory Manual For Human Anatomy & Physiology
Biology
ISBN:9781260159363
Author:Martin, Terry R., Prentice-craver, Cynthia
Publisher:McGraw-Hill Publishing Co.
Inquiry Into Life (16th Edition)
Biology
ISBN:9781260231700
Author:Sylvia S. Mader, Michael Windelspecht
Publisher:McGraw Hill Education
DNA Use In Forensic Science; Author: DeBacco University;https://www.youtube.com/watch?v=2YIG3lUP-74;License: Standard YouTube License, CC-BY
Analysing forensic evidence | The Laboratory; Author: Wellcome Collection;https://www.youtube.com/watch?v=68Y-OamcTJ8;License: Standard YouTube License, CC-BY