
Mathematical Statistics with Applications
7th Edition
ISBN: 9780495110811
Author: Dennis Wackerly, William Mendenhall, Richard L. Scheaffer
Publisher: Cengage Learning
expand_more
expand_more
format_list_bulleted
Videos
Textbook Question
Chapter 11.5, Problem 31E
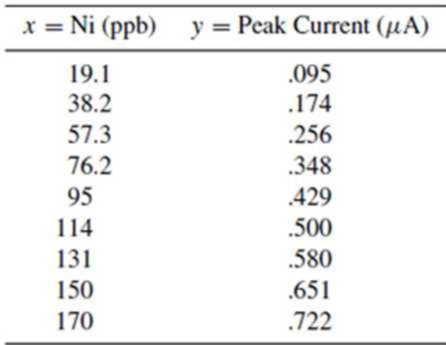
Using a chemical procedure called differential pulse polarography, a chemist measured the peak current generated (in microamperes, µA) when solutions containing different amounts of nickel (measured in parts per billion, ppb) are added to different portions of the same buffer.8 Is there sufficient evidence to indicate that peak current increases as nickel concentrations increase? Use α = .05.
Expert Solution & Answer
Want to see the full answer?
Check out a sample textbook solution
Students have asked these similar questions
A researcher is testing the effect of a new cold and flu medication on reaction time. A sample of n = 16 students is obtained and each student is given the normal dose of the medicine. Thirty minutes later, each student's reaction time is measured. The scores for the sample averaged M = 220 milliseconds with SS = 6000.
Assuming that reaction time for students in the regular population averages μ = 200 milliseconds, are the data sufficient to conclude that the medication has a significant effect on reaction time? Test at the .05 level of significance.
Make a point estimate and a 95% confidence interval estimate for the treated population mean.
Using 1% & 5% alphas, test the overall significance of the model on excel.
Radiation in Baby Teeth Listed below are amounts of strontium-90 (in millibecquerels, or mBq) in a simple random sample of baby teeth obtained from Pennsylvania residents born after 1979 (based on data from “An Unexpected Rise in Strontium-90 in U.S. Deciduous Teeth in the 1990s,” by Mangano et. al., Science of the Total Environment).
Chapter 11 Solutions
Mathematical Statistics with Applications
Ch. 11.3 - If 0 and 1 are the least-squares estimates for the...Ch. 11.3 - Prob. 2ECh. 11.3 - Fit a straight line to the five data points in the...Ch. 11.3 - Auditors are often required to compare the audited...Ch. 11.3 - Prob. 5ECh. 11.3 - Applet Exercise Refer to Exercises 11.2 and 11.5....Ch. 11.3 - Prob. 7ECh. 11.3 - Laboratory experiments designed to measure LC50...Ch. 11.3 - Prob. 9ECh. 11.3 - Suppose that we have postulated the model...
Ch. 11.3 - Some data obtained by C.E. Marcellari on the...Ch. 11.3 - Processors usually preserve cucumbers by...Ch. 11.3 - J. H. Matis and T. E. Wehrly report the following...Ch. 11.4 - a Derive the following identity:...Ch. 11.4 - An experiment was conducted to observe the effect...Ch. 11.4 - Prob. 17ECh. 11.4 - Prob. 18ECh. 11.4 - A study was conducted to determine the effects of...Ch. 11.4 - Suppose that Y1, Y2,,Yn are independent normal...Ch. 11.4 - Under the assumptions of Exercise 11.20, find...Ch. 11.4 - Prob. 22ECh. 11.5 - Use the properties of the least-squares estimators...Ch. 11.5 - Do the data in Exercise 11.19 present sufficient...Ch. 11.5 - Use the properties of the least-squares estimators...Ch. 11.5 - Let Y1, Y2, . . . , Yn be as given in Exercise...Ch. 11.5 - Prob. 30ECh. 11.5 - Using a chemical procedure called differential...Ch. 11.5 - Prob. 32ECh. 11.5 - Prob. 33ECh. 11.5 - Prob. 34ECh. 11.6 - For the simple linear regression model Y = 0 + 1x...Ch. 11.6 - Prob. 36ECh. 11.6 - Using the model fit to the data of Exercise 11.8,...Ch. 11.6 - Refer to Exercise 11.3. Find a 90% confidence...Ch. 11.6 - Refer to Exercise 11.16. Find a 95% confidence...Ch. 11.6 - Refer to Exercise 11.14. Find a 90% confidence...Ch. 11.6 - Prob. 41ECh. 11.7 - Suppose that the model Y=0+1+ is fit to the n data...Ch. 11.7 - Prob. 43ECh. 11.7 - Prob. 44ECh. 11.7 - Prob. 45ECh. 11.7 - Refer to Exercise 11.16. Find a 95% prediction...Ch. 11.7 - Refer to Exercise 11.14. Find a 95% prediction...Ch. 11.8 - The accompanying table gives the peak power load...Ch. 11.8 - Prob. 49ECh. 11.8 - Prob. 50ECh. 11.8 - Prob. 51ECh. 11.8 - Prob. 52ECh. 11.8 - Prob. 54ECh. 11.8 - Prob. 55ECh. 11.8 - Prob. 57ECh. 11.8 - Prob. 58ECh. 11.8 - Prob. 59ECh. 11.8 - Prob. 60ECh. 11.9 - Refer to Example 11.10. Find a 90% prediction...Ch. 11.9 - Prob. 62ECh. 11.9 - Prob. 63ECh. 11.9 - Prob. 64ECh. 11.9 - Prob. 65ECh. 11.10 - Refer to Exercise 11.3. Fit the model suggested...Ch. 11.10 - Prob. 67ECh. 11.10 - Fit the quadratic model Y=0+1x+2x2+ to the data...Ch. 11.10 - The manufacturer of Lexus automobiles has steadily...Ch. 11.10 - a Calculate SSE and S2 for Exercise 11.4. Use the...Ch. 11.12 - Consider the general linear model...Ch. 11.12 - Prob. 72ECh. 11.12 - Prob. 73ECh. 11.12 - An experiment was conducted to investigate the...Ch. 11.12 - Prob. 75ECh. 11.12 - The results that follow were obtained from an...Ch. 11.13 - Prob. 77ECh. 11.13 - Prob. 78ECh. 11.13 - Prob. 79ECh. 11.14 - Prob. 80ECh. 11.14 - Prob. 81ECh. 11.14 - Prob. 82ECh. 11.14 - Prob. 83ECh. 11.14 - Prob. 84ECh. 11.14 - Prob. 85ECh. 11.14 - Prob. 86ECh. 11.14 - Prob. 87ECh. 11.14 - Prob. 88ECh. 11.14 - Refer to the three models given in Exercise 11.88....Ch. 11.14 - Prob. 90ECh. 11.14 - Prob. 91ECh. 11.14 - Prob. 92ECh. 11.14 - Prob. 93ECh. 11.14 - Prob. 94ECh. 11 - At temperatures approaching absolute zero (273C),...Ch. 11 - A study was conducted to determine whether a...Ch. 11 - Prob. 97SECh. 11 - Prob. 98SECh. 11 - Prob. 99SECh. 11 - Prob. 100SECh. 11 - Prob. 102SECh. 11 - Prob. 103SECh. 11 - An experiment was conducted to determine the...Ch. 11 - Prob. 105SECh. 11 - Prob. 106SECh. 11 - Prob. 107SE
Knowledge Booster


Learn more about
Need a deep-dive on the concept behind this application? Look no further. Learn more about this topic, statistics and related others by exploring similar questions and additional content below.Similar questions
- NASA is conducting an experiment to find out the fraction of people who black out at G forces greater than 6. Step 1 of 2: Suppose a sample of 502 people is drawn. Of these people, 140 passed out at G forces greater than 6. Using the data, estimate the proportion of people who pass out at more than 6 Gs. Enter your answer as a fraction or a decimal number rounded to three decimal places.arrow_forwardTo investigate the fluid mechanics of swimming, twenty swimmers each swam a specified distance in a water-filled pool and in a pool where the water was thickened with food grade guar gum to create a syrup-like consistency. Velocity, in meters per second, was recorded and the results are given in a table below. The researchers concluded that swimming in guar syrup does not change swimming speed. (Use a statistical computer package to calculate the P-value. Use ?d = ?water − ?guar syrup. Round your test statistic to two decimal places and your P-value to three decimal places.) Swimmer Velocity (m/s) Water Guar Syrup 1 1.43 1.23 2 1.02 1.96 3 1.37 1.54 4 1.23 1.76 5 1.42 1.07 6 1.09 1.63 7 1.56 1.31 8 1.33 1.58 9 1.96 1.30 10 1.89 1.23 11 1.15 1.15 12 1.11 2.00 13 1.31 1.59 14 1.79 1.23 15 1.12 1.05 16 1.84 1.12 17 1.72 1.42 18 1.99 1.79 19 1.53 1.80 20 0.92 1.69 t = df = P-value = Is there sufficient evidence to suggest that…arrow_forwardUsing 1% & 5% alphas, test the overall significance of the model.arrow_forward
- Poly(3-hydroxybutyrate) (PHB), a semicrystalline polymer that is fully biodegradable and biocompatible, is obtained from renewable resources. From a sustainability perspective, PHB offers many attractive properties though it is more expensive to produce than standard plastics. The accompanying data on melting point (°C) for each of 12 specimensof the polymer using a differential scanning calorimeter appeared in the article “The Melting Behaviour of Poly (3-Hydroxybutyrate) by DSC. Reproducibility Study” (Polymer Testing, 2013: 215-220). Compute the following:a. The sample rangeb. The sample variance s2 from the definition [Hint: First subtract 180 from each observation.]c. The sample standard deviationd. s2 using the shortcut methodarrow_forwardPoly(3-hydroxybutyrate) (PHB), a semicrystalline polymer that is fully biodegradable and biocompatible, is obtained from renewable resources. From a sustainability perspective, PHB offers many attractive properties though it is more expensive to produce than standard plastics. The accompanying data on melting point (°C) for each of 12 specimens of the polymer using a differential scanning calorimeter appeared in an article. 180.4 181.7 180.9 181.7 182.7 181.5 181.4 182.1 182.1 180.4 181.8 180.4 Compute the following. (Round your answer to two decimal places.) b. the sample variance s2 from the definition [Hint: First subtract 180 from each observation.] c. the sample standard deviation d. s2 using the shortcut methodarrow_forward10. A pharmacist attempts to weigh 120 mg of codeine sulfate on a balance with a sensitivity requirement of 6 mg. Calculate the maximum potential error in terms of percentage.arrow_forward
- The amount of oxygen consumption (ml/min) was measured in 6 individuals over two 10- minute periods while sitting with their eyes closed. During the first period, they listen to an exciting adventure story and then again, an hour later while they heard restful music. Based on the results shown, is oxygen consumption different depending on whether it is a story or music one is listening to? The data is in Table 2 and test at an alpha of 0.05. -Do using formulas not excelarrow_forwardLong-distance runners have contended that moderate exposure to ozone increases lungcapacity. To investigate this possibility, a researcher exposed 12 rats to ozone at the rateof 2 parts per million for a period of 30 days. The lung capacity of rats was determined atthe beginning of the study and again after the 30 days of ozone exposure. The lungcapacities (in mL) are given here:(a) If we can assume normality, is there sufficient evidence to support the conjecture thatozone exposure increases lung capacity? Use α = 0.01? b) Estimate the size of the increase in lung capacity after exposure to ozone. Use a 99%confidence interval.arrow_forwardThe article “Effect of Internal Gas Pressure on the Com- pression Strength of Beverage Cans and Plastic Bottles” (J. of Testing and Evaluation, 1993: 129–131) includes the accompanying data on compression strength (lb) for a sample of 12-oz aluminum cans filled with strawberry drink and another sample filled with cola. Does the data suggest that the extra carbonation of cola results in a higher average compression strength? Base your answer on a P-value. What assumptions are necessary for your analysis? ( use ? = 0.01 )arrow_forward
arrow_back_ios
arrow_forward_ios
Recommended textbooks for you
 Linear Algebra: A Modern IntroductionAlgebraISBN:9781285463247Author:David PoolePublisher:Cengage Learning
 Algebra & Trigonometry with Analytic GeometryAlgebraISBN:9781133382119Author:SwokowskiPublisher:Cengage
 Glencoe Algebra 1, Student Edition, 9780079039897...AlgebraISBN:9780079039897Author:CarterPublisher:McGraw Hill
Linear Algebra: A Modern Introduction
Algebra
ISBN:9781285463247
Author:David Poole
Publisher:Cengage Learning
Algebra & Trigonometry with Analytic Geometry
Algebra
ISBN:9781133382119
Author:Swokowski
Publisher:Cengage
Glencoe Algebra 1, Student Edition, 9780079039897...
Algebra
ISBN:9780079039897
Author:Carter
Publisher:McGraw Hill
Hypothesis Testing using Confidence Interval Approach; Author: BUM2413 Applied Statistics UMP;https://www.youtube.com/watch?v=Hq1l3e9pLyY;License: Standard YouTube License, CC-BY
Hypothesis Testing - Difference of Two Means - Student's -Distribution & Normal Distribution; Author: The Organic Chemistry Tutor;https://www.youtube.com/watch?v=UcZwyzwWU7o;License: Standard Youtube License