
Mathematical Statistics with Applications
7th Edition
ISBN: 9780495110811
Author: Dennis Wackerly, William Mendenhall, Richard L. Scheaffer
Publisher: Cengage Learning
expand_more
expand_more
format_list_bulleted
Concept explainers
Videos
Textbook Question
Chapter 11.6, Problem 38E
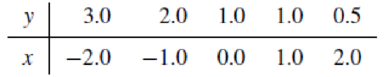
Refer to Exercise 11.3. Find a 90% confidence interval for E(Y) when x* = 0. Then find 90% confidence intervals for E(Y) when x* = –2 and x* = +2. Compare the lengths of these intervals. Plot these confidence limits on the graph you constructed for Exercise 11.3.
11.3 Fit a straight line to the five data points in the accompanying table. Give the estimates of β0and β1. Plot the points and sketch the fitted line as a check on the calculations.
Expert Solution & Answer
Want to see the full answer?
Check out a sample textbook solution
Students have asked these similar questions
A major credit card company is interested in whether there is a linear relationship between its internal rating of a customer’s credit risk and that of an independent rating agency. The company collected a random sample of 200 customers and used the data to test the claim that there is a linear relationship. The following hypotheses were used to test the claim.
H0:β1=0Ha:β1≠0
The test yielded a t-value of 3.34 with a corresponding p-value of 0.001. Which of the following is the correct interpretation of the p-value?
If the alternative hypothesis is true, the probability of observing a test statistic at least as extreme as 3.34 is 0.001.
If the alternative hypothesis is true, the probability of observing a test statistic at least as extreme as 3.34 is 0.001.
A
If the alternative hypothesis is true, the probability of observing a test statistic of 3.34 or greater is 0.001.
If the alternative hypothesis is true, the probability of observing a test statistic of 3.34 or greater…
b) Find the critical value of t for a
90%
confidence interval with
df=58.
Suppose the true inverse demand relation for good X is Qdx = a + bPx + cM + e , and you estimated the parameters to be â = 22, b ˆ = −1.8, σâ = 2.5 , and σb ˆ = 0.7 . Find the approximate 95 percent confidence interval for the true values of a and b.
Chapter 11 Solutions
Mathematical Statistics with Applications
Ch. 11.3 - If 0 and 1 are the least-squares estimates for the...Ch. 11.3 - Prob. 2ECh. 11.3 - Fit a straight line to the five data points in the...Ch. 11.3 - Auditors are often required to compare the audited...Ch. 11.3 - Prob. 5ECh. 11.3 - Applet Exercise Refer to Exercises 11.2 and 11.5....Ch. 11.3 - Prob. 7ECh. 11.3 - Laboratory experiments designed to measure LC50...Ch. 11.3 - Prob. 9ECh. 11.3 - Suppose that we have postulated the model...
Ch. 11.3 - Some data obtained by C.E. Marcellari on the...Ch. 11.3 - Processors usually preserve cucumbers by...Ch. 11.3 - J. H. Matis and T. E. Wehrly report the following...Ch. 11.4 - a Derive the following identity:...Ch. 11.4 - An experiment was conducted to observe the effect...Ch. 11.4 - Prob. 17ECh. 11.4 - Prob. 18ECh. 11.4 - A study was conducted to determine the effects of...Ch. 11.4 - Suppose that Y1, Y2,,Yn are independent normal...Ch. 11.4 - Under the assumptions of Exercise 11.20, find...Ch. 11.4 - Prob. 22ECh. 11.5 - Use the properties of the least-squares estimators...Ch. 11.5 - Do the data in Exercise 11.19 present sufficient...Ch. 11.5 - Use the properties of the least-squares estimators...Ch. 11.5 - Let Y1, Y2, . . . , Yn be as given in Exercise...Ch. 11.5 - Prob. 30ECh. 11.5 - Using a chemical procedure called differential...Ch. 11.5 - Prob. 32ECh. 11.5 - Prob. 33ECh. 11.5 - Prob. 34ECh. 11.6 - For the simple linear regression model Y = 0 + 1x...Ch. 11.6 - Prob. 36ECh. 11.6 - Using the model fit to the data of Exercise 11.8,...Ch. 11.6 - Refer to Exercise 11.3. Find a 90% confidence...Ch. 11.6 - Refer to Exercise 11.16. Find a 95% confidence...Ch. 11.6 - Refer to Exercise 11.14. Find a 90% confidence...Ch. 11.6 - Prob. 41ECh. 11.7 - Suppose that the model Y=0+1+ is fit to the n data...Ch. 11.7 - Prob. 43ECh. 11.7 - Prob. 44ECh. 11.7 - Prob. 45ECh. 11.7 - Refer to Exercise 11.16. Find a 95% prediction...Ch. 11.7 - Refer to Exercise 11.14. Find a 95% prediction...Ch. 11.8 - The accompanying table gives the peak power load...Ch. 11.8 - Prob. 49ECh. 11.8 - Prob. 50ECh. 11.8 - Prob. 51ECh. 11.8 - Prob. 52ECh. 11.8 - Prob. 54ECh. 11.8 - Prob. 55ECh. 11.8 - Prob. 57ECh. 11.8 - Prob. 58ECh. 11.8 - Prob. 59ECh. 11.8 - Prob. 60ECh. 11.9 - Refer to Example 11.10. Find a 90% prediction...Ch. 11.9 - Prob. 62ECh. 11.9 - Prob. 63ECh. 11.9 - Prob. 64ECh. 11.9 - Prob. 65ECh. 11.10 - Refer to Exercise 11.3. Fit the model suggested...Ch. 11.10 - Prob. 67ECh. 11.10 - Fit the quadratic model Y=0+1x+2x2+ to the data...Ch. 11.10 - The manufacturer of Lexus automobiles has steadily...Ch. 11.10 - a Calculate SSE and S2 for Exercise 11.4. Use the...Ch. 11.12 - Consider the general linear model...Ch. 11.12 - Prob. 72ECh. 11.12 - Prob. 73ECh. 11.12 - An experiment was conducted to investigate the...Ch. 11.12 - Prob. 75ECh. 11.12 - The results that follow were obtained from an...Ch. 11.13 - Prob. 77ECh. 11.13 - Prob. 78ECh. 11.13 - Prob. 79ECh. 11.14 - Prob. 80ECh. 11.14 - Prob. 81ECh. 11.14 - Prob. 82ECh. 11.14 - Prob. 83ECh. 11.14 - Prob. 84ECh. 11.14 - Prob. 85ECh. 11.14 - Prob. 86ECh. 11.14 - Prob. 87ECh. 11.14 - Prob. 88ECh. 11.14 - Refer to the three models given in Exercise 11.88....Ch. 11.14 - Prob. 90ECh. 11.14 - Prob. 91ECh. 11.14 - Prob. 92ECh. 11.14 - Prob. 93ECh. 11.14 - Prob. 94ECh. 11 - At temperatures approaching absolute zero (273C),...Ch. 11 - A study was conducted to determine whether a...Ch. 11 - Prob. 97SECh. 11 - Prob. 98SECh. 11 - Prob. 99SECh. 11 - Prob. 100SECh. 11 - Prob. 102SECh. 11 - Prob. 103SECh. 11 - An experiment was conducted to determine the...Ch. 11 - Prob. 105SECh. 11 - Prob. 106SECh. 11 - Prob. 107SE
Knowledge Booster


Learn more about
Need a deep-dive on the concept behind this application? Look no further. Learn more about this topic, statistics and related others by exploring similar questions and additional content below.Similar questions
- A series of tests of fire prevention sprinkler systems that use a foaming agent to quell the fire were performed to determine how long it took (in seconds) for the sprinklers to be activated after the detection of a fire by the system. The system has been designed so that the true average activation time is supposed to be at most 25 seconds. Do the data strongly indicate that the design specifications have not been met? The data for the test are given below: 27 41 22 27 23 35 30 33 24 27 28 22 24arrow_forwardA researcher predicts that scores in treatment A will be higher than scores in treatment B. If the mean for the 10 participants in treatment A is 4 points higher than the mean for the 10 participants in treatment B and the data produce t = 2.095, what decision should be made? a. With a = .05, reject H0 for a one-tailed test but fail to reject for a two-tailed test b. With a = .05, reject H0 for a two-tailed test but fail to reject for a one-tailed test c. With a = .05, fail to reject H0 for both a one-tailed and a two-tailed test d. With a = .05, reject H0 for both a one-tailed and a two-tailed testarrow_forwardA dentist wanted to determine if a relationship existed between childhood fluoride exposure and cavities. She took a sample of adults in her practice and counted how many cavities each person had in his or her permanent teeth. She also determined how many years of childhood each person was exposed to tap water with fluoride. The minimum value on this variable was 0 and the maximum was 18. Using the data below, an alpha of .05 and a two-tailed test, was there a significant relationship? Years of fluoride Number of cavities 0 10 18 1 2 7 12 3 3 4 10 5 M = 7.5s =6.98 M = 5.00s = 3.16arrow_forward
- If the value of Cronbach’s alpha is 0.07, it means ___________; a. Research instrument is not reliable b. Research instrument is internally consistent c. Data is reliable d. Data is internally consistentarrow_forwardStock y has a beta of 1.2 and an expected return of 11.5. Stock z has a beta of .80 and an expected return of 8.5 percentarrow_forwardFor parts a and b, use the t tables, software, or a calculator to estimate. For parts c and d, use software or a calculator to estimate. a) the critical value of t for a 95% confidence interval with df=15. b) the critical value of t for a 90% confidence interval with df=61. c) the P-value for t≥1.66 with 10 degrees of freedom. d) the P-value for t>2.46 with 24 degrees of freedom. LOADING... Click the icon to view the t table. a) What is the critical value of t for a 95% confidence interval with df=15? nothing (Round to two decimal places as needed.) b) What is the critical value of t for a 90% confidence interval with df=61? nothing (Round to two decimal places as needed.) c) What is the P-value for t≥1.66 with 10 degrees of freedom? nothing (Round to three decimal places as needed.) d) What is the P-value for t>2.46 with 24 degrees of freedom? nothing (Round to three decimal places as needed.)arrow_forward
- Dr. Castillejo feels that the maximum pulse rate during the run is a good predictor in explaining the oxygen consumption in the blood stream. He asserts that if the pulse rate at the end of the run increased, then the oxygen consumption will also increase, hence his/her heart is functioning well. Based on the R commanderoutput below, check if the data on oxygen consumption and maximum pulse rate (from 152 bpm to 196bpm) support Dr. Castillejo’s assertion.arrow_forwardIn simple linear regression, at what value of the independent variable, X, will the 95% confidence interval for the average value of Y be narrowest? At what value will the 95% prediction interval for the value of Y for a sin gle new observation be narrowest?arrow_forwardA sample of 20 students who had recently taken elementary statistics yielded the following information on brand of calculator owned. (T = Texas Instruments, H = Hewlett Packard, C = Casio, S = Sharp): C T S S T C S H C T H H H H T T T T H T (a) Estimate the true proportion of all such students who own a Texas Instruments calculator.(b) Of the 8 students who owned a TI calculator, 6 had graphing calculators. Estimate the proportion of students who do not own a TI graphing calculator.arrow_forward
- As a bonus assignment a former student checked if your professor gave a statisticallysignificant difference in grades between his male and female students. She based herstudy based on grades assigned in intermediate Econ courses (Econ 303, 305 and 317)and her sample included nm = 485 male students and nf = 264 female students. Theaverage grades received were xm = 84.6 and xf = 85.8 The population standad deviation were σ m = 12.0 and σ f = 11.4 8. From the same extra-credit study as in question 7 see above, this former student found that the proportion of female students in principle courses (Econ 203, 205) was ?̅? = 0.380, while the proportion of female students in intermediate courses (Econ 303, 305, 317) was ?̅? = 0.352. The principle courses sample size was np = 782, while the intermediate courses sample size was ni = 749. Test the hypothesis that female students are less in intermediate courses using a 90% confidence level and the p-value approach.arrow_forwardAssume the model: Y = 5 - 2X + e , where e ~ N(0,81) What is the expected value of Y when X =1? Now What is the standard deviation of Y when X=0? Now What is the Pr(Y>10) when X =2? Now What is the Pr(-6 < Y < 21) when X=1?arrow_forwardIf the df value for a two tailed test with alpha =0.05 were to increase from df=5 to df=22,what would happen to the critical values for t?arrow_forward
arrow_back_ios
SEE MORE QUESTIONS
arrow_forward_ios
Recommended textbooks for you
 Glencoe Algebra 1, Student Edition, 9780079039897...AlgebraISBN:9780079039897Author:CarterPublisher:McGraw Hill
Glencoe Algebra 1, Student Edition, 9780079039897...
Algebra
ISBN:9780079039897
Author:Carter
Publisher:McGraw Hill
Statistics 4.1 Point Estimators; Author: Dr. Jack L. Jackson II;https://www.youtube.com/watch?v=2MrI0J8XCEE;License: Standard YouTube License, CC-BY
Statistics 101: Point Estimators; Author: Brandon Foltz;https://www.youtube.com/watch?v=4v41z3HwLaM;License: Standard YouTube License, CC-BY
Central limit theorem; Author: 365 Data Science;https://www.youtube.com/watch?v=b5xQmk9veZ4;License: Standard YouTube License, CC-BY
Point Estimate Definition & Example; Author: Prof. Essa;https://www.youtube.com/watch?v=OTVwtvQmSn0;License: Standard Youtube License
Point Estimation; Author: Vamsidhar Ambatipudi;https://www.youtube.com/watch?v=flqhlM2bZWc;License: Standard Youtube License