
Mathematical Statistics with Applications
7th Edition
ISBN: 9780495110811
Author: Dennis Wackerly, William Mendenhall, Richard L. Scheaffer
Publisher: Cengage Learning
expand_more
expand_more
format_list_bulleted
Concept explainers
Videos
Textbook Question
Chapter 11.5, Problem 25E
Do the data in Exercise 11.19 present sufficient evidence to indicate that the number of errors is linearly related to the number of hours without sleep?
- a Give bounds on the attained significance level.
- b Applet Exercise Determine the exact p-value.
- c Based on your answers to parts (a) and/or (b), what would you conclude at the α = .05 level of significance?
- d Would you expect the relationship between y and x to be linear if x were varied over a wider
range , say, from x = 4 to x = 48? - e Give a 95% confidence interval for the slope. Provide a practical interpretation for this
interval estimate.
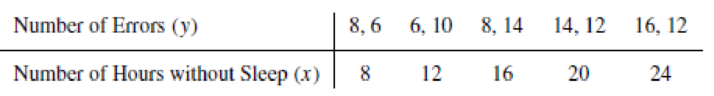
11.19 A study was conducted to determine the effects of sleep deprivation on subjects’ ability to solve simple problems. The amount of sleep deprivation varied over 8, 12, 16, 20, and 24 hours without sleep. A total of ten subjects participated in the study, two at each sleep-deprivation level. After his or her specified sleep-deprivation period, each subject was administered a set of simple addition problems, and the number of errors was recorded. The results shown in the following table were obtained.
- a Find the least-squares line appropriate to these data.
- b Plot the points and graph the least-squares line as a check on your calculations.
- c Calculate S2.
Expert Solution & Answer
Want to see the full answer?
Check out a sample textbook solution
Students have asked these similar questions
An econometrician suspects that the residuals of her model might be autocorrelated. Explain the steps involved in testing this theory using the Durbin–Watson (DW) test
The Update to the Task Force Report on Blood Pressure Control in Children [12] reported the observed 90th per-centile of SBP in single years of age from age 1 to 17 based on prior studies. The data for boys of average height are given in Table 11.18. Suppose we seek a more efficient way to display the data and choose linear regression to accomplish this task.
age sbp
1 99
2 102
3 105
4 107
5 108
6 110
7 111
8 112
9 114
10 115
11 117
12 120
13 122
14 125
15 127
16 130
17 132
Do you think the linear regression provides a good fit to the data? Why or why not? Use residual analysis to justify your answer.
Am I supposed to run a residual plot and QQ-plot for this question?
Compute the least-squares regression equation for the given data set. Round the slope and
y-intercept to at least four decimal places.
2
4
7
6
6
5
3
3
4
2
Chapter 11 Solutions
Mathematical Statistics with Applications
Ch. 11.3 - If 0 and 1 are the least-squares estimates for the...Ch. 11.3 - Prob. 2ECh. 11.3 - Fit a straight line to the five data points in the...Ch. 11.3 - Auditors are often required to compare the audited...Ch. 11.3 - Prob. 5ECh. 11.3 - Applet Exercise Refer to Exercises 11.2 and 11.5....Ch. 11.3 - Prob. 7ECh. 11.3 - Laboratory experiments designed to measure LC50...Ch. 11.3 - Prob. 9ECh. 11.3 - Suppose that we have postulated the model...
Ch. 11.3 - Some data obtained by C.E. Marcellari on the...Ch. 11.3 - Processors usually preserve cucumbers by...Ch. 11.3 - J. H. Matis and T. E. Wehrly report the following...Ch. 11.4 - a Derive the following identity:...Ch. 11.4 - An experiment was conducted to observe the effect...Ch. 11.4 - Prob. 17ECh. 11.4 - Prob. 18ECh. 11.4 - A study was conducted to determine the effects of...Ch. 11.4 - Suppose that Y1, Y2,,Yn are independent normal...Ch. 11.4 - Under the assumptions of Exercise 11.20, find...Ch. 11.4 - Prob. 22ECh. 11.5 - Use the properties of the least-squares estimators...Ch. 11.5 - Do the data in Exercise 11.19 present sufficient...Ch. 11.5 - Use the properties of the least-squares estimators...Ch. 11.5 - Let Y1, Y2, . . . , Yn be as given in Exercise...Ch. 11.5 - Prob. 30ECh. 11.5 - Using a chemical procedure called differential...Ch. 11.5 - Prob. 32ECh. 11.5 - Prob. 33ECh. 11.5 - Prob. 34ECh. 11.6 - For the simple linear regression model Y = 0 + 1x...Ch. 11.6 - Prob. 36ECh. 11.6 - Using the model fit to the data of Exercise 11.8,...Ch. 11.6 - Refer to Exercise 11.3. Find a 90% confidence...Ch. 11.6 - Refer to Exercise 11.16. Find a 95% confidence...Ch. 11.6 - Refer to Exercise 11.14. Find a 90% confidence...Ch. 11.6 - Prob. 41ECh. 11.7 - Suppose that the model Y=0+1+ is fit to the n data...Ch. 11.7 - Prob. 43ECh. 11.7 - Prob. 44ECh. 11.7 - Prob. 45ECh. 11.7 - Refer to Exercise 11.16. Find a 95% prediction...Ch. 11.7 - Refer to Exercise 11.14. Find a 95% prediction...Ch. 11.8 - The accompanying table gives the peak power load...Ch. 11.8 - Prob. 49ECh. 11.8 - Prob. 50ECh. 11.8 - Prob. 51ECh. 11.8 - Prob. 52ECh. 11.8 - Prob. 54ECh. 11.8 - Prob. 55ECh. 11.8 - Prob. 57ECh. 11.8 - Prob. 58ECh. 11.8 - Prob. 59ECh. 11.8 - Prob. 60ECh. 11.9 - Refer to Example 11.10. Find a 90% prediction...Ch. 11.9 - Prob. 62ECh. 11.9 - Prob. 63ECh. 11.9 - Prob. 64ECh. 11.9 - Prob. 65ECh. 11.10 - Refer to Exercise 11.3. Fit the model suggested...Ch. 11.10 - Prob. 67ECh. 11.10 - Fit the quadratic model Y=0+1x+2x2+ to the data...Ch. 11.10 - The manufacturer of Lexus automobiles has steadily...Ch. 11.10 - a Calculate SSE and S2 for Exercise 11.4. Use the...Ch. 11.12 - Consider the general linear model...Ch. 11.12 - Prob. 72ECh. 11.12 - Prob. 73ECh. 11.12 - An experiment was conducted to investigate the...Ch. 11.12 - Prob. 75ECh. 11.12 - The results that follow were obtained from an...Ch. 11.13 - Prob. 77ECh. 11.13 - Prob. 78ECh. 11.13 - Prob. 79ECh. 11.14 - Prob. 80ECh. 11.14 - Prob. 81ECh. 11.14 - Prob. 82ECh. 11.14 - Prob. 83ECh. 11.14 - Prob. 84ECh. 11.14 - Prob. 85ECh. 11.14 - Prob. 86ECh. 11.14 - Prob. 87ECh. 11.14 - Prob. 88ECh. 11.14 - Refer to the three models given in Exercise 11.88....Ch. 11.14 - Prob. 90ECh. 11.14 - Prob. 91ECh. 11.14 - Prob. 92ECh. 11.14 - Prob. 93ECh. 11.14 - Prob. 94ECh. 11 - At temperatures approaching absolute zero (273C),...Ch. 11 - A study was conducted to determine whether a...Ch. 11 - Prob. 97SECh. 11 - Prob. 98SECh. 11 - Prob. 99SECh. 11 - Prob. 100SECh. 11 - Prob. 102SECh. 11 - Prob. 103SECh. 11 - An experiment was conducted to determine the...Ch. 11 - Prob. 105SECh. 11 - Prob. 106SECh. 11 - Prob. 107SE
Knowledge Booster


Learn more about
Need a deep-dive on the concept behind this application? Look no further. Learn more about this topic, statistics and related others by exploring similar questions and additional content below.Similar questions
- A researcher hypothesizes that in a certain country the net annual growth of private sector purchases of government bonds, B, is positively related to the nominal rate of interest on the bonds, NI, and negatively related to the rate of inflation Π: Bt = a0 + a1NIt + a2Π t + ut Note that it may be hypothesized that B depends on the real rate of interest on bonds, R, where R = NI – Π. Using a sample of 56 annual observations, s/he estimates the following equations: (1) Bt = 0.43 + 0.90NIt - 0.97Πt R21 = 0.962, SSR1 = 2.20, QRESET(F1,52) = 16.6 (3.58) (8.80) (-1.05) (2) Bt = 0.44 + 0.94Rt R22 = 0.960, SSR2 = 2.22, QRESET(F1,53) = 0.9 (9.70) (16.7) (3) Bt = 0.44 + 1.14NIt SSR3 = 9.20, QRESET(F1,53) = 59.9 (8.84) (36.1) (4) NIt = 0.08 + 0.94Πt R24 = 0.997, SSR4 = 0.18, QRESET(F1,53) = 1.4…arrow_forwardA sixth-grade teacher believes that there is a relationship between his students’ IQscores (y) and the numbers of hours (x) they spend watching television each week. Thefollowing table shows a random sample of 7 sixth-grade students.y 125 116 97 114 85 107 105x 5 10 30 16 41 28 21 Does the data provide sufficient evidence to indicate that the simple linear regressionmodel is appropriate to describe the relationship between x and y? Perform a model utilitytest at α = 0.05. (Give H0, Ha, rejection region, observed test statistic, P-value, decisionand conclusion.)Find the Pearson sample correlation coefficient between x and y. Then interpretthe result.arrow_forwardIn exercise 1, the following estimated regression equation based on 10 observations was presented. y^=29.1270+.5906x1+.4980x2Develop a point estimate of the mean value of y when x1=180 and x2=310. Predict an individual value of y when x1=180 and x2=310.arrow_forward
- A major credit card company is interested in whether there is a linear relationship between its internal rating of a customer’s credit risk and that of an independent rating agency. The company collected a random sample of 200 customers and used the data to test the claim that there is a linear relationship. The following hypotheses were used to test the claim. H0:β1=0Ha:β1≠0 The test yielded a t-value of 3.34 with a corresponding p-value of 0.001. Which of the following is the correct interpretation of the p-value? If the alternative hypothesis is true, the probability of observing a test statistic at least as extreme as 3.34 is 0.001. If the alternative hypothesis is true, the probability of observing a test statistic at least as extreme as 3.34 is 0.001. A If the alternative hypothesis is true, the probability of observing a test statistic of 3.34 or greater is 0.001. If the alternative hypothesis is true, the probability of observing a test statistic of 3.34 or greater…arrow_forwardon the basis of the value of linear correlation coefficient, would you conclude, at the /r/>0.9 level, that the data can be reasonably modeled linear equation?arrow_forwardInterpret the following three sets of data using scatter chart and regression analysis, using slope , intercept, Coefficient of Determiniation (R2) , regression data (using excel), and 95% confidence interval, P value, do I reject null hypothesis ? Or is it significant ? Generate and explain the derivation of insights using regression analysis and its associated visualization. Differentiate between the signals identified by business analytics and the noise that is inherent in the system. X: C18 (total employees hours worked per week) versus Y: C19 (clinic patients seen per week) C18 8 22 35 40 57 73 78 87 98 C19 6.16 9.88 14.35 24.06 30.34 32.17 42.18 43.23 48.76 check_circle Expert Answer thumb_up thumb_down Step 1 Let us denote X as the total employees hours worked per week and Y as the clinic patients seen per week. Excel Procedure: Enter X and Y data in Excel Go to Data Click on Data Analysis……..> ‘Regression’.…arrow_forward
- Test the null hypothesis that the slope is zero versus the two-sided alternative in the following setting using the alpha=0.05 signifiance level. n=20, yhat=28.5+1.4x, and SEb1=0.65arrow_forwardThe accompanying data file contains 40 observations on the response variable y along with the predictor variables x1 and x2. Use the holdout method to compare the predictability of the linear model with the exponential model using the first 30 observations for training and the remaining 10 observations for validation. y x1 x2 533.86 20 30 104.84 15 20 64.89 20 23 159.61 16 21 43.06 13 16 4.27 13 13 736.56 15 30 64.89 20 23 10.64 20 22 76.90 18 20 4.89 11 13 80.90 11 16 224.17 12 19 45.75 16 25 8.13 17 17 319.97 13 30 48.61 19 25 564.67 12 27 111.87 11 25 152.39 13 24 13.34 18 14 28.80 15 22 37.56 13 15 105.62 17 26 44.05 18 21 451.65 17 28 10.34 18 21 32.70 12 13 19.21 14 12 14.02 15 16 2.45 16 12 2.48 20 15 50.34 17 21 29.31 17 20 33.75 16 12 196.28 17 29 943.12 13 30 7.25 10 12 89.73 15 25 32.91 12 18 1. Use the training set to estimate Models 1 and 2. Note: Negative values should be indicated by a…arrow_forwardIn an attempt to develop a model of wine quality as judged by wine experts, data on alcohol content and wine quality was collected from variants of a particular wine. From a sample of 17 wines, a model was created using the percentages of alcohol to predict wine quality. From the results of that regression, b1=0.4386 and Sb1=0.1141. a. At the 0.05 level of significance, is there evidence of a linear relationship between the percentage of alcohol and wine quality? b. Construct a 95% confidence interval estimate of the population slope, β1. b. The 95% confidence interval is __ ≤ β1 ≤ __ (Round to three decimal places as needed.)arrow_forward
- A study was conducted to detemine whether a the final grade of a student in an introductory psychology course is linearly related to his or her performance on the verbal ability test administered before college entrance. The verbal scores and final grades for 10 students are shown in the table below. Student Verbal Score x Final Grade y 1 37 43 2 38 46 3 33 39 4 57 67 5 60 74 6 64 80 7 47 59 8 66 76 9 28 30 10 53 62 Should the regression be used to predict the final grade of a student with a verbal score of 100? answer: ?arrow_forwarda. Estimate the average value of the steel tensile strength when the carbon amount is 320 mg/g, and construct a 95% confidence interval for this estimate. b. Predict the strength of the steel when the carbon amount is 200 mg/g and construct a 95% prediction interval. c. Plot Residuals vs Fitted Value graph and comment on the regression model. x 100 125 125 150 150 200 200 250 250 300 300 350 403 402 y 155 142 180 210 190 320 280 400 430 440 390 600 610 670arrow_forwardIn a multiple linear regression model with 3 predictor variables, what is the t-statistic for the hypothesis test of the null hypothesis that the coefficient of the second predictor variable is equal to 0, if the estimated coefficient is 0.5, the standard error of the estimate is 0.1, and the degrees of freedom is 15?arrow_forward
arrow_back_ios
SEE MORE QUESTIONS
arrow_forward_ios
Recommended textbooks for you
 Big Ideas Math A Bridge To Success Algebra 1: Stu...AlgebraISBN:9781680331141Author:HOUGHTON MIFFLIN HARCOURTPublisher:Houghton Mifflin Harcourt
Big Ideas Math A Bridge To Success Algebra 1: Stu...
Algebra
ISBN:9781680331141
Author:HOUGHTON MIFFLIN HARCOURT
Publisher:Houghton Mifflin Harcourt
Correlation Vs Regression: Difference Between them with definition & Comparison Chart; Author: Key Differences;https://www.youtube.com/watch?v=Ou2QGSJVd0U;License: Standard YouTube License, CC-BY
Correlation and Regression: Concepts with Illustrative examples; Author: LEARN & APPLY : Lean and Six Sigma;https://www.youtube.com/watch?v=xTpHD5WLuoA;License: Standard YouTube License, CC-BY