
Mathematical Statistics with Applications
7th Edition
ISBN: 9780495110811
Author: Dennis Wackerly, William Mendenhall, Richard L. Scheaffer
Publisher: Cengage Learning
expand_more
expand_more
format_list_bulleted
Concept explainers
Videos
Textbook Question
Chapter 11.3, Problem 14E
J. H. Matis and T. E. Wehrly report the following table of data on the proportion of green sunfish that survive a fixed level of thermal pollution for varying lengths of time.
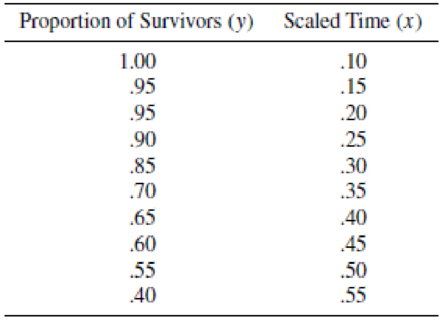
- a Fit the linear model Y = β0 + β1x + ε. Give your interpretation.
- b Plot the points and graph the result of part (a). Does the line fit through the points?
Expert Solution & Answer
Want to see the full answer?
Check out a sample textbook solution
Students have asked these similar questions
Given the “data” determined by y = x^3 + (x-1)^2 with x = 0.1, 1.2, 2.3, and 2.9, calculate SSTO, SSR, and R^2. Then recalculate these using x = 0.3, 1, 2.45, and 2.8. Does where you collect your data (i.e., which values of x) appear to impact your interpretation of how good the linear model fits?.
The data in the following table show five students' reading test scores and final exam grades in a history class.
Reading Test Score, x
8.5
9.4
10.0
11.4
12.0
History Final Exam Grade, y
62
68
74
87
92
(a)
Use the points (8.5, 62) and (10.0, 74) to find a linear model that will predict a student's final exam grade, y, given his or her reading test score, x.
y =
(b)
Use your linear model to estimate a student's final exam grade in the history class given that the student's reading test score was 9.5.
Q, 1:
Environtech Engineering, a company that specializes in the construction of antipollution filtration devices, has recorded the following sales record over the last 9 years:
Year
1987
1988
1989
1990
1991
1992
1993
1994
1995
Sales (x 100,000)
13
15
19
21
27
35
47
49
97
a) Plot these data with suitable scale and define shape.
b) Develop the linear estimating equation that best describes these data, and plot this line on the graph from part (a).
c) Develop the second-degree estimating equation that best describes these data, and plot this curve on the graph from part (a).
d) Does the market to the best of your knowledge favor (b) or (c) as the more accurate estimating method?
Chapter 11 Solutions
Mathematical Statistics with Applications
Ch. 11.3 - If 0 and 1 are the least-squares estimates for the...Ch. 11.3 - Prob. 2ECh. 11.3 - Fit a straight line to the five data points in the...Ch. 11.3 - Auditors are often required to compare the audited...Ch. 11.3 - Prob. 5ECh. 11.3 - Applet Exercise Refer to Exercises 11.2 and 11.5....Ch. 11.3 - Prob. 7ECh. 11.3 - Laboratory experiments designed to measure LC50...Ch. 11.3 - Prob. 9ECh. 11.3 - Suppose that we have postulated the model...
Ch. 11.3 - Some data obtained by C.E. Marcellari on the...Ch. 11.3 - Processors usually preserve cucumbers by...Ch. 11.3 - J. H. Matis and T. E. Wehrly report the following...Ch. 11.4 - a Derive the following identity:...Ch. 11.4 - An experiment was conducted to observe the effect...Ch. 11.4 - Prob. 17ECh. 11.4 - Prob. 18ECh. 11.4 - A study was conducted to determine the effects of...Ch. 11.4 - Suppose that Y1, Y2,,Yn are independent normal...Ch. 11.4 - Under the assumptions of Exercise 11.20, find...Ch. 11.4 - Prob. 22ECh. 11.5 - Use the properties of the least-squares estimators...Ch. 11.5 - Do the data in Exercise 11.19 present sufficient...Ch. 11.5 - Use the properties of the least-squares estimators...Ch. 11.5 - Let Y1, Y2, . . . , Yn be as given in Exercise...Ch. 11.5 - Prob. 30ECh. 11.5 - Using a chemical procedure called differential...Ch. 11.5 - Prob. 32ECh. 11.5 - Prob. 33ECh. 11.5 - Prob. 34ECh. 11.6 - For the simple linear regression model Y = 0 + 1x...Ch. 11.6 - Prob. 36ECh. 11.6 - Using the model fit to the data of Exercise 11.8,...Ch. 11.6 - Refer to Exercise 11.3. Find a 90% confidence...Ch. 11.6 - Refer to Exercise 11.16. Find a 95% confidence...Ch. 11.6 - Refer to Exercise 11.14. Find a 90% confidence...Ch. 11.6 - Prob. 41ECh. 11.7 - Suppose that the model Y=0+1+ is fit to the n data...Ch. 11.7 - Prob. 43ECh. 11.7 - Prob. 44ECh. 11.7 - Prob. 45ECh. 11.7 - Refer to Exercise 11.16. Find a 95% prediction...Ch. 11.7 - Refer to Exercise 11.14. Find a 95% prediction...Ch. 11.8 - The accompanying table gives the peak power load...Ch. 11.8 - Prob. 49ECh. 11.8 - Prob. 50ECh. 11.8 - Prob. 51ECh. 11.8 - Prob. 52ECh. 11.8 - Prob. 54ECh. 11.8 - Prob. 55ECh. 11.8 - Prob. 57ECh. 11.8 - Prob. 58ECh. 11.8 - Prob. 59ECh. 11.8 - Prob. 60ECh. 11.9 - Refer to Example 11.10. Find a 90% prediction...Ch. 11.9 - Prob. 62ECh. 11.9 - Prob. 63ECh. 11.9 - Prob. 64ECh. 11.9 - Prob. 65ECh. 11.10 - Refer to Exercise 11.3. Fit the model suggested...Ch. 11.10 - Prob. 67ECh. 11.10 - Fit the quadratic model Y=0+1x+2x2+ to the data...Ch. 11.10 - The manufacturer of Lexus automobiles has steadily...Ch. 11.10 - a Calculate SSE and S2 for Exercise 11.4. Use the...Ch. 11.12 - Consider the general linear model...Ch. 11.12 - Prob. 72ECh. 11.12 - Prob. 73ECh. 11.12 - An experiment was conducted to investigate the...Ch. 11.12 - Prob. 75ECh. 11.12 - The results that follow were obtained from an...Ch. 11.13 - Prob. 77ECh. 11.13 - Prob. 78ECh. 11.13 - Prob. 79ECh. 11.14 - Prob. 80ECh. 11.14 - Prob. 81ECh. 11.14 - Prob. 82ECh. 11.14 - Prob. 83ECh. 11.14 - Prob. 84ECh. 11.14 - Prob. 85ECh. 11.14 - Prob. 86ECh. 11.14 - Prob. 87ECh. 11.14 - Prob. 88ECh. 11.14 - Refer to the three models given in Exercise 11.88....Ch. 11.14 - Prob. 90ECh. 11.14 - Prob. 91ECh. 11.14 - Prob. 92ECh. 11.14 - Prob. 93ECh. 11.14 - Prob. 94ECh. 11 - At temperatures approaching absolute zero (273C),...Ch. 11 - A study was conducted to determine whether a...Ch. 11 - Prob. 97SECh. 11 - Prob. 98SECh. 11 - Prob. 99SECh. 11 - Prob. 100SECh. 11 - Prob. 102SECh. 11 - Prob. 103SECh. 11 - An experiment was conducted to determine the...Ch. 11 - Prob. 105SECh. 11 - Prob. 106SECh. 11 - Prob. 107SE
Knowledge Booster


Learn more about
Need a deep-dive on the concept behind this application? Look no further. Learn more about this topic, statistics and related others by exploring similar questions and additional content below.Similar questions
- Find the slope of the line containing each pair of points in Exercise 1. a 6,4 and 6,-3 c -5,2 and 7,-3 b 1,4 and -5,4 d x-3,y+2 and x,y-2arrow_forwardThe following chart is data over an 8-month period that shows how much a company spent in advertising and the sales revenue for that month MONTH ADVERTISING $ SALES $ March 900 56000 April 2700 89200 May 3150 98500 June 1300 54000 July 3400 97000 Aug 1500 56000 Sept 2300 93000 Oct 2250 79000 What is the linear equation (y = mx + b form) that best approximates the relationship between advertising dollars spent(x) and sales revenue(y) based on the above 8 months of data? (round to 2 decimals for the slope and the y intercept) describe how you utilized excel to arrive at this equationarrow_forwardThe table below shows the number of state-registered automatic weapons and the murder rate for several Northwestern states. x 11.9 8.6 7.1 3.8 2.3 2.3 2.2 0.3 y 14.3 11 9.9 7.3 5.7 5.7 5.6 4.1 x = thousands of automatic weaponsy = murders per 100,000 residentsThis data can be modeled by the equation y=0.87x+3.75. Use this equation to answer the following; Special Note: I suggest you verify this equation by performing linear regression on your calculator.A) How many murders per 100,000 residents can be expected in a state with 5 thousand automatic weapons?Answer = Round to 3 decimal places.B) How many murders per 100,000 residents can be expected in a state with 10.5 thousand automatic weapons?Answer = Round to 3 decimal places.arrow_forward
- The data in the table below are not linear, but if we omit the first point, the remaining data are linear. Make a linear model for these last three points. (Enter your answer in terms of x.) x -1 1 3 5 y 3 8 14 20arrow_forwardThe data in the following table show the amount of water in milliliters a professional tennis player loses for various times, in minutes, of play during a tennis match. Time of Workout(in minutes), x 10 20 30 40 50 60 Water Lost(in milliliters), y 600 900 1,200 1,500 2,000 2,200 (a)Use the points (10, 600) and (60, 2,200) to find a linear model that will predict the water lost y (in mL) by a player who has been playing for x minutes. (b) Use your linear model to estimate the amount of water lost (in mL) by a player who has been playing for 15 minutes.arrow_forwardBased on the data shown below, a statistician calculates a linear model y=2.41x+2.76y=2.41x+2.76. x y 4 12.5 5 14.35 6 16.9 7 20.65 8 22.1 9 23.95 Use the model to estimate the yy-value when x=9x=9y=y=arrow_forward
- The data in the table below show five students' reading test grade and final exam grade in a history class. Reading test score, x 8.5 9.4 10.0 11.4 12.0 History final exam grade, y 64 68 76 87 92 (a) Use the points (8.5, 64) and (10.0, 76) to find a linear model that will predict a student's final exam grade given his or her reading test score. f(x) = (b) Use your linear model to estimate a student's final exam grade in the history class given that the student's reading test grade was 10.3. Round to the nearest whole number.arrow_forwardTo fit a simple linear regression model to the data and to provide its equation (d = a*t + b), along with R2 Day Date Weekday Daily Demand Weekend 1 4/25/2016 Mon 297 0 2 4/26/2016 Tue 293 0 3 4/27/2016 Wed 327 0 4 4/28/2016 Thu 315 0 5 4/29/2016 Fri 348 0 6 4/30/2016 Sat 447 1 7 5/1/2016 Sun 431 1 8 5/2/2016 Mon 283 0 9 5/3/2016 Tue 326 0 10 5/4/2016 Wed 317 0 11 5/5/2016 Thu 345 0 12 5/6/2016 Fri 355 0 13 5/7/2016 Sat 428 1 14 5/8/2016 Sun 454 1 15 5/9/2016 Mon 305 0 16 5/10/2016 Tue 310 0 17 5/11/2016 Wed 350 0 18 5/12/2016 Thu 308 0 19 5/13/2016 Fri 366 0 20 5/14/2016 Sat 460 1 21 5/15/2016 Sun 427 1 22 5/16/2016 Mon 291 0 23 5/17/2016 Tue 325 0 24 5/18/2016 Wed 354 0 25 5/19/2016 Thu 322 0 26 5/20/2016 Fri 405 0 27 5/21/2016 Sat 442 1 28 5/22/2016 Sun 454 1 29 5/23/2016 Mon 318 0 30 5/24/2016 Tue 298 0 31 5/25/2016 Wed 355 0 32 5/26/2016 Thu 355 0 33 5/27/2016 Fri 374 0 34 5/28/2016 Sat 447 1 35 5/29/2016…arrow_forwardThe data in the following table show the amount of water in milliliters a professional tennis player loses for various times, in minutes, of play during a tennis match. Time of Workout(in minutes), x 10 20 30 40 50 60 Water Lost(in milliliters), y 500 900 1,200 1,500 2,000 2,200 (a) Use the points (10, 500) and (60, 2,200) to find a linear model that will predict the water lost y (in mL) by a player who has been playing for x minutes. y = (b) Use your linear model to estimate the amount of water lost (in mL) by a player who has been playing for 15 minutes. mLarrow_forward
- The table below shows the number of state-registered automatic weapons and the murder rate for several Northwestern states. x 11.5 8.5 6.7 3.8 2.6 2.5 2.3 0.4 y 13.9 11.4 9.5 7.1 6.3 6.2 6.1 4.2 x = thousands of automatic weaponsy = murders per 100,000 residents This data can be modeled by the equation y=0.86x+3.96. Use this equation to answer the following; Special Note: I suggest you verify this equation by performing linear regression on your calculator. A) How many murders per 100,000 residents can be expected in a state with 1.8 thousand automatic weapons? Answer = Round to 3 decimal places. B) How many murders per 100,000 residents can be expected in a state with 9.7 thousand automatic weapons? Answer = Round to 3 decimal places.arrow_forwardI do not have data analysis on my excel, I have no idea how to solve this. The table below contains the average public school classroom teacher's salaries, yy, for an 11-year period. If xx represents the number of years since 1990, use Excel to find a linear model for the data. Year 1990 1991 1992 1993 1994 1995 Salary 33855 35031 34984 34221 35488 37443 Year 1996 1997 1998 1999 2000 Salary 37188 40370 40627 41311 43954 With the salary given by y=mx+b m=? b=?arrow_forwardA cell phone company offers aninternational plan by charging $30 for the first 80 minutes, plus$0.50 for each minute over 80.(a) Write a linear model that relates the cost C, in dollars, oftalking x minutes, assuming x ≥ 80.(b) What is the cost of talking 105 minutes? 120 minutes?arrow_forward
arrow_back_ios
SEE MORE QUESTIONS
arrow_forward_ios
Recommended textbooks for you
 Linear Algebra: A Modern IntroductionAlgebraISBN:9781285463247Author:David PoolePublisher:Cengage Learning
 Elementary Geometry For College Students, 7eGeometryISBN:9781337614085Author:Alexander, Daniel C.; Koeberlein, Geralyn M.Publisher:Cengage,
 Glencoe Algebra 1, Student Edition, 9780079039897...AlgebraISBN:9780079039897Author:CarterPublisher:McGraw Hill
Linear Algebra: A Modern Introduction
Algebra
ISBN:9781285463247
Author:David Poole
Publisher:Cengage Learning
Elementary Geometry For College Students, 7e
Geometry
ISBN:9781337614085
Author:Alexander, Daniel C.; Koeberlein, Geralyn M.
Publisher:Cengage,
Glencoe Algebra 1, Student Edition, 9780079039897...
Algebra
ISBN:9780079039897
Author:Carter
Publisher:McGraw Hill
Correlation Vs Regression: Difference Between them with definition & Comparison Chart; Author: Key Differences;https://www.youtube.com/watch?v=Ou2QGSJVd0U;License: Standard YouTube License, CC-BY
Correlation and Regression: Concepts with Illustrative examples; Author: LEARN & APPLY : Lean and Six Sigma;https://www.youtube.com/watch?v=xTpHD5WLuoA;License: Standard YouTube License, CC-BY