
Probability and Statistics for Engineering and the Sciences
9th Edition
ISBN: 9781305251809
Author: Jay L. Devore
Publisher: Cengage Learning
expand_more
expand_more
format_list_bulleted
Concept explainers
Videos
Textbook Question
Chapter 12, Problem 73SE
The presence of hard alloy carbides in high chromium white iron alloys results in excellent abrasion resistance, making them suitable for materials handling in the mining and materials processing industries. The accompanying data on x = retained austenite content (%) and y = abrasive wear loss (mm3) in pin wear tests with garnet as the abrasive was read from a plot in the article “Microstructure-Property Relationships in High Chromium White Iron Alloys” (Intl. Materials Reviews, 1996: 59–82).
| x | 4.6 | 17.0 | 17.4 | 18.0 | 18.5 | 22.4 | 26.5 | 30.0 | 34.0 |
| y | .66 | .92 | 1.45 | 1.03 | .70 | .73 | 1.20 | .80 | .91 |
| x | 38.8 | 48.2 | 63.5 | 65.8 | 73.9 | 77.2 | 79.8 | 84.0 |
| y | 1.19 | 1.15 | 1.12 | 1.37 | 1.45 | 1.50 | 1.36 | 1.29 |
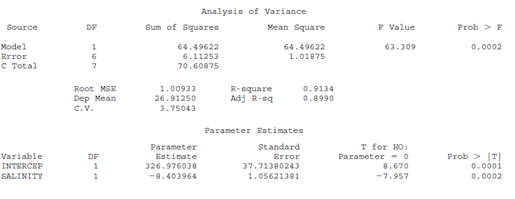
SAS output for Exercise 72
Dependent Variable: NITRLVL
Expert Solution & Answer
Want to see the full answer?
Check out a sample textbook solution
Students have asked these similar questions
A study is made of the relationship between annual production volume of Good A and factory floor area. Table below shows the data from a sample of 10 factories.
Factory
Factory floor area, X (‘000m2 )
Annual production volume, Y ($‘ 000)
1
40
3.5
2
600
25.0
3
60
4.8
4
72
3.5
5
400
30.0
6
90
5.0
7
200
12.0
8
70
4.5
9
80
5.0
10
84
6.0
Construct a scatter plot.
What is the slope coefficient for the horsepower variable? Is this coefficient significant at 5% level of significance (alpha=0.05)?
Accumulation of mercury (Hg) in fish is hypothesized to correlate with the fish size. Barbonymus schwanenfeldii is a species commonly found in a dam in Sarawak. Table 1 shows data of Hg concentration (mg/kg) present in three sizes of fish caught in the dam in triplicates.
Chapter 12 Solutions
Probability and Statistics for Engineering and the Sciences
Ch. 12.1 - The efficiency ratio for a steel specimen immersed...Ch. 12.1 - The article Exhaust Emissions from Four-Stroke...Ch. 12.1 - Bivariate data often arises from the use of two...Ch. 12.1 - The accompanying data on y = ammonium...Ch. 12.1 - The article Objective Measurement of the...Ch. 12.1 - One factor in the development of tennis elbow, a...Ch. 12.1 - The article Some Field Experience in the Use of an...Ch. 12.1 - Referring to Exercise 7, suppose that the standard...Ch. 12.1 - The flow rate y (m3/min) in a device used for...Ch. 12.1 - Suppose the expected cost of a production run is...
Ch. 12.1 - Suppose that in a certain chemical process the...Ch. 12.2 - Refer back to the data in Exercise 4, in which y =...Ch. 12.2 - The accompanying data on y = ammonium...Ch. 12.2 - Refer to the lank temperature-efficiency ratio...Ch. 12.2 - Values of modulus of elasticity (MOE, the ratio of...Ch. 12.2 - The article Characterization of Highway Runoff in...Ch. 12.2 - For the past decade, rubber powder has been used...Ch. 12.2 - For the past decade, rubber powder has been used...Ch. 12.2 - The following data is representative of that...Ch. 12.2 - The bond behavior of reinforcing bars is an...Ch. 12.2 - Wrinkle recovery angle and tensile strength are...Ch. 12.2 - Calcium phosphate cement is gaining increasing...Ch. 12.2 - a. Obtain SSE for the data in Exercise 19 from the...Ch. 12.2 - The invasive diatom species Didymosphenia geminata...Ch. 12.2 - Prob. 25ECh. 12.2 - Show that the point of averages (x,y) lies on the...Ch. 12.2 - Prob. 27ECh. 12.2 - a. Consider the data in Exercise 20. Suppose that...Ch. 12.2 - Consider the following three data sets, in which...Ch. 12.3 - Reconsider the situation described in Exercise 7,...Ch. 12.3 - During oil drilling operations, components of the...Ch. 12.3 - Exercise 16 of Section 12.2 gave data on x =...Ch. 12.3 - During oil drilling operations, components of the...Ch. 12.3 - For the past decade, rubber powder has been used...Ch. 12.3 - Refer back to the data in Exercise 4, in which y =...Ch. 12.3 - Misi (airborne droplets or aerosols) is generated...Ch. 12.3 - Prob. 37ECh. 12.3 - Refer to the data on x = liberation rate and y =...Ch. 12.3 - Carry out the model utility test using the ANOVA...Ch. 12.3 - Prob. 40ECh. 12.3 - Prob. 41ECh. 12.3 - Verify that if each xi is multiplied by a positive...Ch. 12.3 - Prob. 43ECh. 12.4 - Fitting the simple linear regression model to the...Ch. 12.4 - Reconsider the filtration ratemoisture content...Ch. 12.4 - Astringency is the quality in a wine that makes...Ch. 12.4 - The simple linear regression model provides a very...Ch. 12.4 - Prob. 48ECh. 12.4 - You are told that a 95% CI for expected lead...Ch. 12.4 - Prob. 50ECh. 12.4 - Refer to Example 12.12 in which x = test track...Ch. 12.4 - Plasma etching is essential to the fine-line...Ch. 12.4 - Consider the following four intervals based on the...Ch. 12.4 - The height of a patient is useful for a variety of...Ch. 12.4 - Prob. 55ECh. 12.4 - The article Bone Density and Insertion Torque as...Ch. 12.5 - The article Behavioural Effects of Mobile...Ch. 12.5 - The Turbine Oil Oxidation Test (TOST) and the...Ch. 12.5 - Toughness and fibrousness of asparagus are major...Ch. 12.5 - Head movement evaluations are important because...Ch. 12.5 - Prob. 61ECh. 12.5 - Prob. 62ECh. 12.5 - Prob. 63ECh. 12.5 - The accompanying data on x = UV transparency index...Ch. 12.5 - Torsion during hip external rotation and extension...Ch. 12.5 - Prob. 66ECh. 12.5 - Prob. 67ECh. 12 - The appraisal of a warehouse can appear...Ch. 12 - Prob. 69SECh. 12 - Forensic scientists are often interested in making...Ch. 12 - Phenolic compounds are found in the effluents of...Ch. 12 - The SAS output at the bottom of this page is based...Ch. 12 - The presence of hard alloy carbides in high...Ch. 12 - The accompanying data was read from a scatterplot...Ch. 12 - An investigation was carried out to study the...Ch. 12 - Prob. 76SECh. 12 - Open water oil spills can wreak terrible...Ch. 12 - In Section 12.4, we presented a formula for...Ch. 12 - Show that SSE=Syy1Sxy, which gives an alternative...Ch. 12 - Suppose that x and y are positive variables and...Ch. 12 - Let sx and sy denote the sample standard...Ch. 12 - Verify that the t statistic for testing H0: 1 = 0...Ch. 12 - Use the formula for computing SSE to verify that...Ch. 12 - In biofiltration of wastewater, air discharged...Ch. 12 - Normal hatchery processes in aquaculture...Ch. 12 - Prob. 86SECh. 12 - Prob. 87SE
Knowledge Booster


Learn more about
Need a deep-dive on the concept behind this application? Look no further. Learn more about this topic, statistics and related others by exploring similar questions and additional content below.Similar questions
- Assume we have data demonstrating a strong linear link between the amount of fertilizer applied to certain plants and their yield. Which is the independent variable in this research question?arrow_forwardCreate a residual plot and comment on the appropriateness of the model.arrow_forwardA student working on a physics project investigated the relationship between the speed and the height of roller coasters. The student collected data on the maximum speed, in miles per hour, and the maximum height, in feet, for a random sample of 2121 roller coasters, with the intent of testing the slope of the linear relationship between maximum speed and maximum height. However, based on the residual plot shown, the conditions for such a test might not be met.arrow_forward
- Refer to the data display from a sample of airport data speeds in Mbps. What is the number of degrees of freedom that should be used for finding the critical value ta/2 ?arrow_forwardIs there evidence of significant linear correlation and find the critical values of r.arrow_forwardA fast-food chain decided to carry out an experiment to assess the influence of advertising expenditure on sales. Different relative changes in advertising expenditure, compared to the previous year, were made in eight regions of the country, and resulting changes in sales levels were observed the accompanying table shows the results. Increase in advertising expenditure (%) 0 5 15 20 25 30 35 40 Increase in sales (%) 5 10 18 25 35 50 60 65 Determine the value of ∑X, ∑X2, ∑Y, ∑Y2, ∑XY. Where X represent independent variable and Y for dependent variable. Determine and interpret the coefficient of correlation between the two variables. Determine the value of regressions coefficients and write down the simple linear regression model.…arrow_forward
- A fast-food chain decided to carry out an experiment to assess the influence of advertising expenditure on sales. Different relative changes in advertising expenditure, compared to the previous year, were made in eight regions of the country, and resulting changes in sales levels were observed the accompanying table shows the results. Increase in advertising expenditure (%) 0 5 15 20 25 30 35 40 Increase in sales (%) 5 10 18 25 35 50 60 65 Determine the value of ∑X, ∑X2, ∑Y, ∑Y2, ∑XY. Where X represent independent variable and Y for dependent variable. Determine and interpret the coefficient of correlation between the two variables. Determine the value of regressions coefficients and write down the simple linear regression model. Test the validity of the model…arrow_forwardHere is a bivariate data set. Find the regression equation for the response variable y. x y 60.9 36.2 55.8 44.3 27.8 61.7 36.1 56.3 56 53.7 49.8 55.2 45.7 51.5 60.1 46.6 63.1 50 63.9 40.2 68.8 45.4 32.3 60.4 76.6 40.6 65.4 46 65.6 42.7 regression equation: Enter the equation in slope-intercept form with parameters accurate to three decimal places.arrow_forwardA paper suggests that the simple linear regression model is reasonable for describing the relationship between y = eggshell thickness (in micrometers, µm) and x = egg length (mm) for quail eggs. Suppose that the population regression line is y = 0.125 + 0.007x and that ?e = 0.005. Then, for a fixed x value, y has a normal distribution with mean 0.125 + 0.007x and standard deviation 0.005. (a) What is the mean eggshell thickness for quail eggs that are 15 mm in length? ____ µm What is the mean eggshell thickness for quail eggs that are 17 mm in length? ____ µm (b) What is the probability that a quail egg with a length of 15 mm will have a shell thickness that is greater than 0.23 µm? _____ (c) Approximately what proportion of quail eggs of length 14 mm have a shell thickness of greater than 0.222? (Hint: The distribution of y at a fixed x is approximately normal. Round your answer to four decimal places.) ____ Approximately what proportion of quail eggs of length…arrow_forward
- Given the table below, Let y, x1, x2, and x3 be the time of concentration (t, in hr), watershed length (L in ft), watershed slope (S in %), and runoff curve number (CN): Evaluate the linear multiple regression model with two or three predictor variables. Compute the multiple correlation coefficient, the standard error of estimate, and the standard deviation of the variable y. Discuss the reliability of the modelarrow_forwardConsider a linear regression model for the decrease in blood pressure (mmHg) over a four-week period with muy=2.8+0.8x and standard deviation chi=3.2. The explanatory variable x is the number of servings fruits and vegetables in a calorie-controlled diet. What is the subpopulation mean when x = 7 servings per day?arrow_forwardButz et al. evaluated the duration of benefit derived from the use of noninvasive positive-pressure ventilation by patients with amyotrophic lateral sclerosis (ALS) on symptoms, quality of life and survival. ALS, aka Lou Gehrig's Disease, is a degenerative disease of the motor neurons. One of the variables of interest is partial pressure of arterial carbon dioxide (PaCO2). The values below (measured in mm Hg) reflect the results of baseline testing on 20 of the 30 subjects in the study, as established by arterial blood gas analyses. (Am. J Med. Rehab. 2003, 82:597-604) 40 47 34 42 54 48 54 57 58 4554 54 43 44 63 42 33 43 52 38 Find the skewness and kurtosis using Excel or Matlab. And Determine if the data are too skewed or too leptokurtic or platykurtic. Also, Determine the coefficient of variation.arrow_forward
arrow_back_ios
SEE MORE QUESTIONS
arrow_forward_ios
Recommended textbooks for you
 MATLAB: An Introduction with ApplicationsStatisticsISBN:9781119256830Author:Amos GilatPublisher:John Wiley & Sons Inc
 Probability and Statistics for Engineering and th...StatisticsISBN:9781305251809Author:Jay L. DevorePublisher:Cengage Learning
 Statistics for The Behavioral Sciences (MindTap C...StatisticsISBN:9781305504912Author:Frederick J Gravetter, Larry B. WallnauPublisher:Cengage Learning
 Elementary Statistics: Picturing the World (7th E...StatisticsISBN:9780134683416Author:Ron Larson, Betsy FarberPublisher:PEARSON
 The Basic Practice of StatisticsStatisticsISBN:9781319042578Author:David S. Moore, William I. Notz, Michael A. FlignerPublisher:W. H. Freeman
 Introduction to the Practice of StatisticsStatisticsISBN:9781319013387Author:David S. Moore, George P. McCabe, Bruce A. CraigPublisher:W. H. Freeman
MATLAB: An Introduction with Applications
Statistics
ISBN:9781119256830
Author:Amos Gilat
Publisher:John Wiley & Sons Inc
Probability and Statistics for Engineering and th...
Statistics
ISBN:9781305251809
Author:Jay L. Devore
Publisher:Cengage Learning
Statistics for The Behavioral Sciences (MindTap C...
Statistics
ISBN:9781305504912
Author:Frederick J Gravetter, Larry B. Wallnau
Publisher:Cengage Learning
Elementary Statistics: Picturing the World (7th E...
Statistics
ISBN:9780134683416
Author:Ron Larson, Betsy Farber
Publisher:PEARSON
The Basic Practice of Statistics
Statistics
ISBN:9781319042578
Author:David S. Moore, William I. Notz, Michael A. Fligner
Publisher:W. H. Freeman
Introduction to the Practice of Statistics
Statistics
ISBN:9781319013387
Author:David S. Moore, George P. McCabe, Bruce A. Craig
Publisher:W. H. Freeman
Correlation Vs Regression: Difference Between them with definition & Comparison Chart; Author: Key Differences;https://www.youtube.com/watch?v=Ou2QGSJVd0U;License: Standard YouTube License, CC-BY
Correlation and Regression: Concepts with Illustrative examples; Author: LEARN & APPLY : Lean and Six Sigma;https://www.youtube.com/watch?v=xTpHD5WLuoA;License: Standard YouTube License, CC-BY