Videos
Bubble behavior in subcooled flow boiling. In industry cooling applications (e.g., cooling of nuclear reactors), a process called subcooled flow boiling is often employed. Subcooled flow boiling is susceptible to small bubbles that occur near the heated surface. The characteristics of these bubbles were investigated in Heat Transfer Engineering (Vol. 34., 2013). A series of experiments was conducted to measure two important bubble behaviors—bubble diameter (millimeters) and bubble density (liters per meters squared). The mass flux (kilograms per meters squared per second) and heat flux (megawatts per meters squared) were varied for each experiment. The data obtained at a set pressure are listed in the following table.
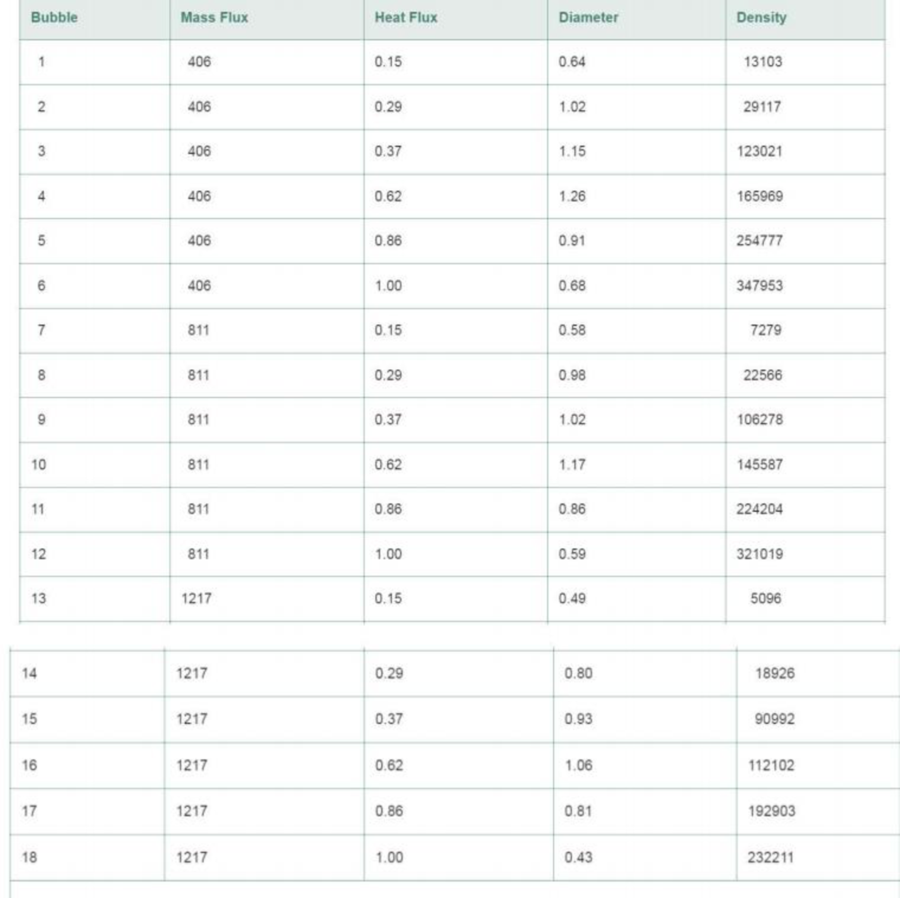
a. Consider the multiple regression model, E (y1) = β0 + β1 x1 + β2x2, where y1 = bubble diameter, x1 = mass flux, and x2 = heat flux. Use statistical software to fit the model to the data and test the overall adequacy of the model.
b. Consider the multiple regression model, E(y2) = β0 + β1 x1 + β2x2, where y2 = bubble density, x1 = mass flux, and x2 = heat flux. Use statistical software to fit the model to the data and test the overall adequacy of the model.
c. Which of the two dependent variables, diameter (y1) or density (y2). is better predicted by mass flux (x1) and heat flux (x2)?
Want to see the full answer?
Check out a sample textbook solution
Chapter 12 Solutions
Statistics Plus New MyLab Statistics with Pearson eText -- Access Card Package (13th Edition)


- An article in the Journal of Applied Polymer Science (Vol. 56, pp. 471–476, 1995) studied the effect of the mole ratio of sebacic acid on the intrinsic viscosity of copolyesters.- The data follows: Viscosity 0.45 0.2 0.34 0.58 0.7 0.57 0.55 0.44 Mole ratio 1 0.9 0.8 0.7 0.6 0.5 0.4 0.3 (a) Construct a scatter diagram of the data.arrow_forwardPlasma etching is essential to the fine-line pattern transfer in semiconductor processes.The article “Ion BeamAssisted Etching of Aluminum with Chlorine” (J. of the Electrochem. Soc.,1985: 2010–2012) gives the accompanying data (read from a graph) on chlorine flow (x, in SCCM)through a nozzle used in the etching mechanism and etch rate (y, in 100 A/min).x <- c(1.5, 1.5, 2.0, 2.5, 2.5, 3.0, 3.5, 3.5, 4.0)y <- c(23.0, 24.5, 25.0, 30.0, 33.5, 40.0, 40.5, 47.0, 49.0) Does the simple linear regression model specify a useful relationship between chlorine flowand etch rate? Estimate the true average change in etch rate associated with a 1-SCCM increase in flowrate using a 95% confidence interval, and interpret the interval.Calculate a 95% CI for µY |x=3.0, the true average etch rate when flow = 3.0. Has this averagebeen precisely estimated? Calculate a 95% PI for a single future observation on etch rate to be made when flow = 3.0.Is the prediction likely to be accurate? Would the 95%…arrow_forwardAn article in the ASCE Journal of Energy Engineering [“Overview of Reservoir Release Improvements at 20 TVA Dams” (Vol. 125, April 1999, pp. 1–17)] presents data on dissolved oxygen concentrations in streams below 20 dams in the Tennessee Valley Authority system. The observations are (in milligrams per liter):arrow_forward
- Here is a dataset containing plant growth measurements of plants grown in solutions of commonly-found chemicals in roadway runoff.Phragmites australis, a fast-growing non-native grass common to roadsides and disturbed wetlands of Tidewater Virginia, was grown in a greenhouse and watered with either: Distilled water (control); A weak petroleum solution (representing standard roadway runoff); Sodium chloride solution; Magnesium chloride solution; De-icing brine (50% sodium chloride and 50% magnesium chloride).Twenty grass preparations were used for each solution, and total growth (in cm) was recorded after watering every other day for 40 days.-Perform the correct statistical test to determine the p-value.-Report your answer rounded to four decimal places.-You should use formulas, functions, and the Data Analysis ToolPak in MS Excel to avoid additive rounding errors. Here are some useful functions: =t.test(array1,array2,tails,type) Produces a p-value for any…arrow_forwardResearchers interested in lead exposure due to car exhaust sampled the blood of 52 police officers subjected to constant inhalation of automobile exhaust fumes while working traffic enforcement in a primarily urban environment. The blood samples of these officers had an average lead concentration of 124.32 µg/l and a SD of 37.74 µg/l; a previous study of individuals from a nearby suburb, with no history of exposure, found an average blood level concentration of 35 µg/l. Test the hypothesis that the downtown police officers have a higher lead exposure than the group in the previous study. Interpret your results in context. Based on your preceding result, without performing a calculation, would a 99% confidence interval for the average blood concentration level of police officers contain 35 µg/l? Based on your preceding result, without performing a calculation, would a 99% confidence interval for this difference contain 0? Explain why or why not.arrow_forwardIn single-sample, upper-tail test hypothesis test, if the researcher changes the alpha level from .05 to .10 then which statement is most true? a) a. the consequences of committing an alpha error are likely severe, all else held constant in the experiment b) b. the RR will comprise a larger area under the curve as a result, all else held constant c) c. the RR will comprise a smaller area under the curve as a result, all else held constant d) d. this image would accurately depict this changearrow_forward
- The article in the ASCE Journal of Energy Engineering (1999, Vol. 125, pp.59-75) describes a study of the thermal inertia properties of autoclaved aerated concrete used as a building material. Five samples of the material were tested in a structure, and the average interior temperatures (°C) reported were as follows: 23.01, 22.22, 22.04, 22.62, and 22.59. Test that the average interior temperature is equal to 22.5°C using alpha (a) = 0.05. This problem is a test on what population parameter? What is the null and alternative hypothesis? What are the Significance level and type of test? What standardized test statistic will be used? What is the standard test statistic? What is the Statistical Decision? What is the statistical decision in the statement form?arrow_forwardThe vulnerability of inshore environments to contamination due to urban and industrial expansion in Mombasa is discussed in the paper “Metals, Petroleum Hydrocarbons and Organo- chlorines in Inshore Sediments and Waters on Mombasa, Kenya” [Marine Pollution Bulletin (1997) 34:570–577]. A geochemical and oceanographic survey of the inshore waters of Mombasa, Kenya, was undertaken during the period from September 1995 to January 1996. In the survey, suspended particulate matter and sediment were collected from 48 stations within Mombasa’s estuarine creeks. The concentrations of major oxides and 13 trace elements were determined for a varying number of cores at each of the stations. In particular, the lead concentrations in sus-pended particulate matter (mg kg21 dry weight) were determined at 37 stations. The researchers were interested in determining whether the average lead concentration was greater than 30 mg kg21 dry weight. The data are given in the following table along with summary…arrow_forwardThe vulnerability of inshore environments to contamination due to urban and industrial expansion in Mombasa is discussed in the paper “Metals, Petroleum Hydrocarbons and Organo- chlorines in Inshore Sediments and Waters on Mombasa, Kenya” [Marine Pollution Bulletin (1997) 34:570–577]. A geochemical and oceanographic survey of the inshore waters of Mombasa, Kenya, was undertaken during the period from September 1995 to January 1996. In the survey, suspended particulate matter and sediment were collected from 48 stations within Mombasa’s estuarine creeks. The concentrations of major oxides and 13 trace elements were determined for a varying number of cores at each of the stations. In particular, the lead concentrations in sus-pended particulate matter (mg kg21 dry weight) were determined at 37 stations. The researchers were interested in determining whether the average lead concentration was greater than 30 mg kg21 dry weight. The data are given in the following table along with summary…arrow_forward
- The vulnerability of inshore environments to contamination due to urban and industrial expansion in Mombasa is discussed in the paper €œMetals, Petroleum Hydrocarbons and Organo-chlorines in Inshore Sediments and Waters on Mombasa, Kenya€ [Marine Pollution Bulletin (1997) 34: 570€“ 577]. A geochemical and oceanographic survey of the inshore waters of Mombasa, Kenya, was undertaken during the period from September 1995 to January 1996. In the survey, suspended particulate matter and sediment were collected from 48 stations within Mombasa€™s estuarine creeks. The concentrations of major oxides and 13 trace elements were determined for a varying number of cores at each of the stations. In particular, the lead concentrations in suspended particulate matter (mg kg-1 dry weight) were determined at 37 stations. The researchers were interested in determining whether the average lead concentration was greater than 30 mg kg-1 dry weight. The data are given in the following table along with…arrow_forwardReference: Camm J.D. et al., (2019) Business Analytics: descriptive, predictive and prescriptive (3rd edition). Cengage ____________________________________________________________________________________ Jay Gatsby categorizes wines into one of three clusters. The centroids of these clusters, describing the average characteristics of a wine in each cluster, are listed in the following table. Characteristic Cluster 1 Cluster 2 Cluster 3 Alcohol 0.819 0.164 -0.937 MalicAcid -0.329 0.869 -0.368 Ash 0.248 0.186 -0.393 Alcalinity…arrow_forwardData for nine girders in the form of the ratio of predicted to observed load for two procedures, the Karlsruhe and Lehigh methods, are as follows: Girder Karlsruhe Lehigh 1 1.186 1.061 2 1.151 0.992 3 1.322 1.063 4 1.339 1.062 5 1.200 1.065 6 1.402 1.178 7 1.365 1.037 8 1.537 1.086 9 1.559 1.052 1) calculate the t-value and what is your conclusion at (α = 0.05)? 2) What is the 90% confidence interval for the difference in means?arrow_forward
 MATLAB: An Introduction with ApplicationsStatisticsISBN:9781119256830Author:Amos GilatPublisher:John Wiley & Sons Inc
 Probability and Statistics for Engineering and th...StatisticsISBN:9781305251809Author:Jay L. DevorePublisher:Cengage Learning
 Statistics for The Behavioral Sciences (MindTap C...StatisticsISBN:9781305504912Author:Frederick J Gravetter, Larry B. WallnauPublisher:Cengage Learning
 Elementary Statistics: Picturing the World (7th E...StatisticsISBN:9780134683416Author:Ron Larson, Betsy FarberPublisher:PEARSON
 The Basic Practice of StatisticsStatisticsISBN:9781319042578Author:David S. Moore, William I. Notz, Michael A. FlignerPublisher:W. H. Freeman
 Introduction to the Practice of StatisticsStatisticsISBN:9781319013387Author:David S. Moore, George P. McCabe, Bruce A. CraigPublisher:W. H. Freeman