
Essentials Of Statistics For Business & Economics
9th Edition
ISBN: 9780357045435
Author: David R. Anderson, Dennis J. Sweeney, Thomas A. Williams, Jeffrey D. Camm, James J. Cochran
Publisher: South-Western College Pub
expand_more
expand_more
format_list_bulleted
Concept explainers
Videos
Textbook Question
Chapter 13, Problem 38SE
Assembly Methods. Three different assembly methods have been proposed for a new product. A completely randomized experimental design was chosen to determine which assembly method results in the greatest number of parts produced per hour, and 30 workers were randomly selected and assigned to use one of the proposed methods. The number of units produced by each worker follows.
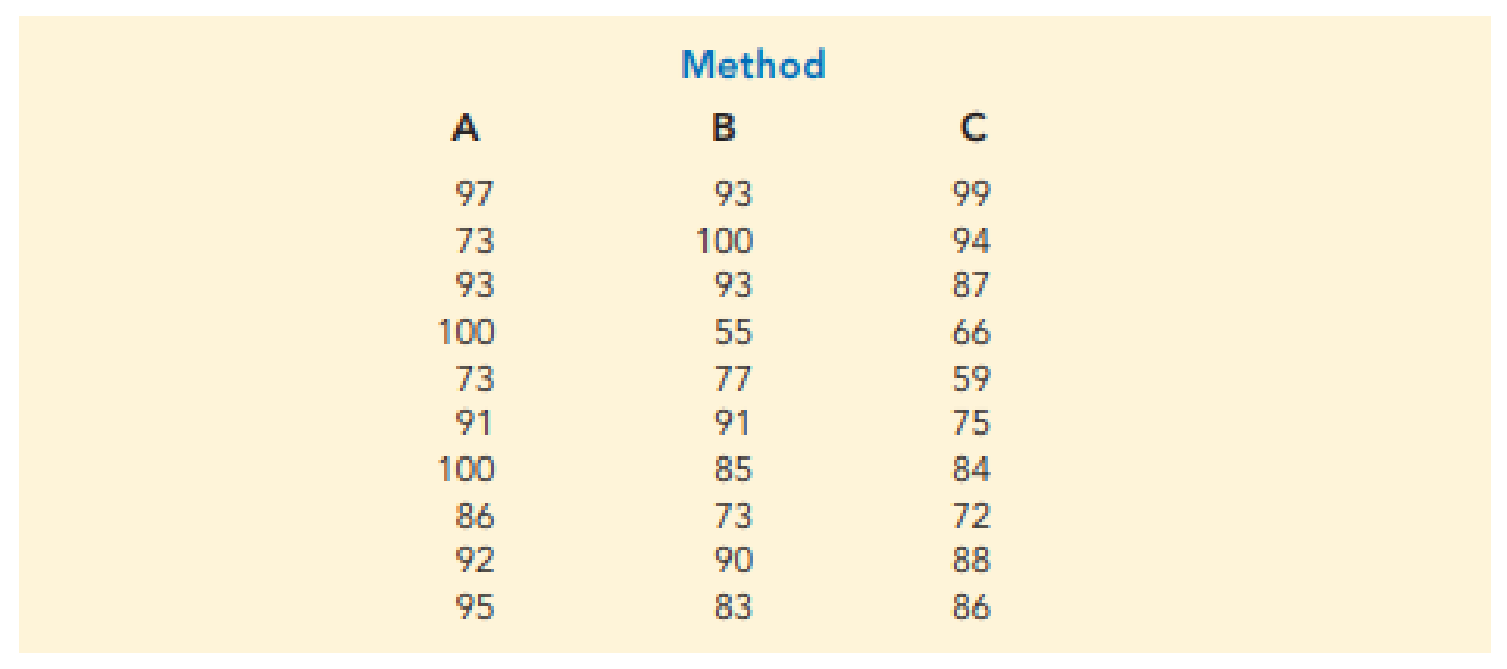
Use these data and test to see whether the mean number of parts produced is the same with each method. Use α = .05.
Expert Solution & Answer

Trending nowThis is a popular solution!

Chapter 13 Solutions
Essentials Of Statistics For Business & Economics
Ch. 13.2 - The following data are from a completely...Ch. 13.2 - 2. In a completely randomized design, seven...Ch. 13.2 - 3. Refer to exercise 2.
what hypotheses are...Ch. 13.2 - 4. In an experiment designed to test the output...Ch. 13.2 - 5. In a completely randomized design, 12...Ch. 13.2 - Develop the analysis of variance computations for...Ch. 13.2 - 7. Three different methods for assembling a...Ch. 13.2 - 8. Refer to the NCP data in Table 13.4. Set up the...Ch. 13.2 - To study the effect of temperature on yield in a...Ch. 13.2 - Prob. 10E
Ch. 13.2 - Paint-Drying Robots. How long it takes paint to...Ch. 13.2 - Restaurant Satisfaction. The Consumer Reports...Ch. 13.3 - The following data are from a completely...Ch. 13.3 - The following data are from a completely...Ch. 13.3 - Testing Chemical Processes. To test whether the...Ch. 13.3 - Confidence Intervals for Different Processes....Ch. 13.3 - Marketing Ethics. In the digital age of marketing,...Ch. 13.3 - Machine Breakdowns. To test for any significant...Ch. 13.3 - Testing Time to Breakdown Between All Pairs of...Ch. 13.3 - Minor league Baseball Attendance. The...Ch. 13.4 - Consider the experimental results for the...Ch. 13.4 - Prob. 22ECh. 13.4 - An experiment has been conducted for four...Ch. 13.4 - Auto Tune-Ups. An automobile dealer conducted a...Ch. 13.4 - Airfares on Travel Websites. Are there differences...Ch. 13.4 - SAT Performance. The Scholastic Aptitude Test...Ch. 13.4 - Consumer Preferences. In 2018, consumer goods...Ch. 13.5 - A factorial experiment involving two levels of...Ch. 13.5 - The calculations for a factorial experiment...Ch. 13.5 - Mobile App Website Design. Based on a 2018 study,...Ch. 13.5 - Amusement Park Queues. An amusement park studied...Ch. 13.5 - Auto Fuel Efficiency. As part of a study designed...Ch. 13.5 - Tax Research. A study reported in The Accounting...Ch. 13 - Paper Towel Absorption. In a completely randomized...Ch. 13 - Job Satisfaction. A study reported in the Journal...Ch. 13 - Prob. 36SECh. 13 - College Attendance Rates. The following data show...Ch. 13 - Assembly Methods. Three different assembly methods...Ch. 13 - Job Automation. A Pew Research study conducted in...Ch. 13 - Fuel Efficiency of Gasoline Brands. A research...Ch. 13 - Late-Night Talk Show Viewership. Jimmy Kimmel...Ch. 13 - Golf Club Design. A major manufacturer of golf...Ch. 13 - Language Translation. A factorial experiment was...Ch. 13 - Defective Parts. A manufacturing company designed...Ch. 13 - CASE PROBLEM 1: WENTWORTH MEDICAL CENTER As part...Ch. 13 - CASE PROBLEM 2: COMPENSATION FOR SALES...Ch. 13 - TOURISTOPIA TRAVEL TourisTopia Travel (Triple T)...
Knowledge Booster


Learn more about
Need a deep-dive on the concept behind this application? Look no further. Learn more about this topic, statistics and related others by exploring similar questions and additional content below.Recommended textbooks for you
 MATLAB: An Introduction with ApplicationsStatisticsISBN:9781119256830Author:Amos GilatPublisher:John Wiley & Sons Inc
 Probability and Statistics for Engineering and th...StatisticsISBN:9781305251809Author:Jay L. DevorePublisher:Cengage Learning
 Statistics for The Behavioral Sciences (MindTap C...StatisticsISBN:9781305504912Author:Frederick J Gravetter, Larry B. WallnauPublisher:Cengage Learning
 Elementary Statistics: Picturing the World (7th E...StatisticsISBN:9780134683416Author:Ron Larson, Betsy FarberPublisher:PEARSON
 The Basic Practice of StatisticsStatisticsISBN:9781319042578Author:David S. Moore, William I. Notz, Michael A. FlignerPublisher:W. H. Freeman
 Introduction to the Practice of StatisticsStatisticsISBN:9781319013387Author:David S. Moore, George P. McCabe, Bruce A. CraigPublisher:W. H. Freeman
MATLAB: An Introduction with Applications
Statistics
ISBN:9781119256830
Author:Amos Gilat
Publisher:John Wiley & Sons Inc
Probability and Statistics for Engineering and th...
Statistics
ISBN:9781305251809
Author:Jay L. Devore
Publisher:Cengage Learning
Statistics for The Behavioral Sciences (MindTap C...
Statistics
ISBN:9781305504912
Author:Frederick J Gravetter, Larry B. Wallnau
Publisher:Cengage Learning
Elementary Statistics: Picturing the World (7th E...
Statistics
ISBN:9780134683416
Author:Ron Larson, Betsy Farber
Publisher:PEARSON
The Basic Practice of Statistics
Statistics
ISBN:9781319042578
Author:David S. Moore, William I. Notz, Michael A. Fligner
Publisher:W. H. Freeman
Introduction to the Practice of Statistics
Statistics
ISBN:9781319013387
Author:David S. Moore, George P. McCabe, Bruce A. Craig
Publisher:W. H. Freeman
Hypothesis Testing - Solving Problems With Proportions; Author: The Organic Chemistry Tutor;https://www.youtube.com/watch?v=76VruarGn2Q;License: Standard YouTube License, CC-BY
Hypothesis Testing and Confidence Intervals (FRM Part 1 – Book 2 – Chapter 5); Author: Analystprep;https://www.youtube.com/watch?v=vth3yZIUlGQ;License: Standard YouTube License, CC-BY