
Essentials Of Statistics For Business & Economics
9th Edition
ISBN: 9780357045435
Author: David R. Anderson, Dennis J. Sweeney, Thomas A. Williams, Jeffrey D. Camm, James J. Cochran
Publisher: South-Western College Pub
expand_more
expand_more
format_list_bulleted
Videos
Textbook Question
Chapter 13.3, Problem 19E
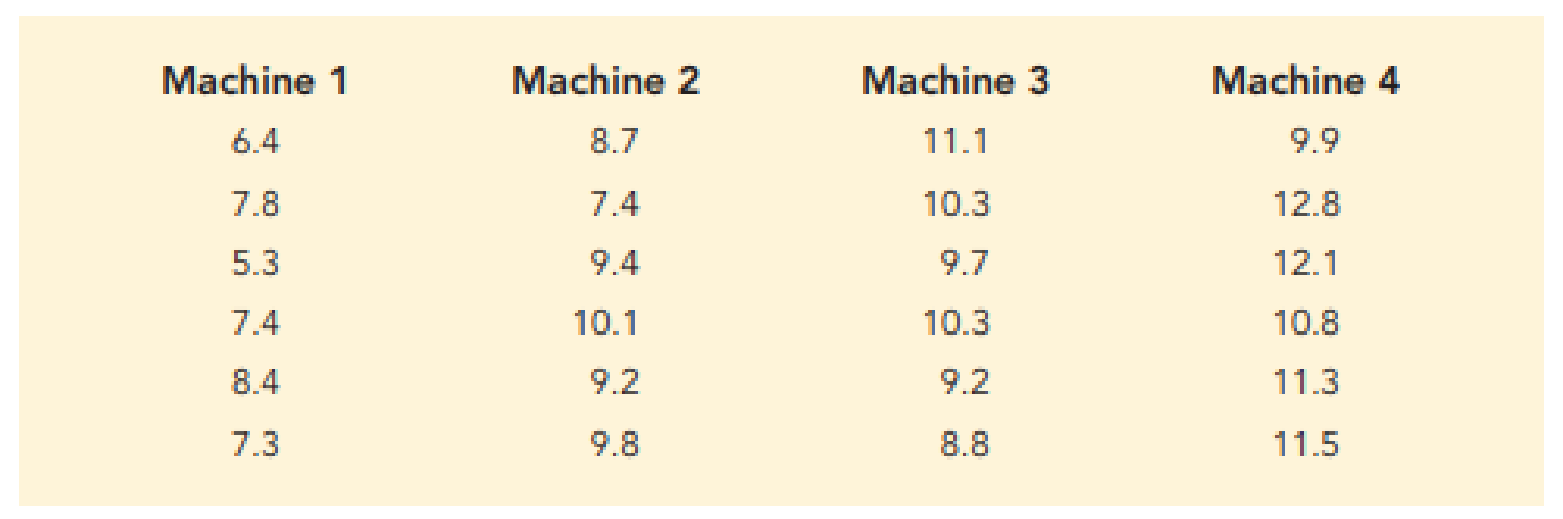
Testing Time to Breakdown Between All Pairs of Machines. Refer to exercise 18. Use the Bonferroni adjustment to test for a significant difference between all pairs of means. Assume that a maximum overall experiment wise error rate of .05 is desired.
18. Machine Breakdowns. To test for any significant difference in the number of hours between breakdowns for four machines, the following data were obtained.
- a. At the α = .05 level of significance, what is the difference, if any, in the population
mean times among the four machines? - b. Use Fisher’s LSD procedure to test for the equality of the means for machines 2 and 4. Use a .05 level of significance.
Expert Solution & Answer
Want to see the full answer?
Check out a sample textbook solution
Students have asked these similar questions
1. What does it imply if if more values are concentrated above the mean? (Skewness) And would the value of skewness be less than, greater than, or equal to 0?
2. In case the data is highly skewed, can we still rely on the kurtosis coefficient? Why or why not?
3. Can the z-score be a real measure of dispersion?
The united States ranks ninth in the world in per capita chocolate consumption; the aver- age American eats 9.5 pounds of chocolate annually (Forbes, July 22, 2015). Suppose you are curious whether chocolate consumption is higher in Hershey, Pennsylvania, the location of The Hershey Company’s corporate headquarters. A sample of 36 individuals from the Hershey area showed a sample mean annual consumption of 10.05 pounds and a standard devi- ation of s = 1.5 pounds. using α = 0.05, do the sample results support the conclusion that mean annual consumption of chocolate is higher in Hershey than it is throughout the united States?
Arsenic-based additives in chicken feed have been banned by the European Union. Ifa restaurant chain finds significant evidence that the mean arsenic level of theirchickens is above 80 ppb (parts per billion), the chain will stop using that supplier ofchicken meat. The hypotheses are:
H 0 : µ = 80H 1 : µ > 80
where µ represents the mean arsenic level in all chicken meat from that supplier.Samples from two different suppliers are analyzed, and the resulting p-values aregiven:
Sample from Supplier A: p-value is 0.0003Sample from Supplier B: p-value is 0.3500
a) Interpret each p-value in terms of the probability of the results happening byrandom chance.
b) Which p-value shows stronger evidence for the alternative hypothesis?
c) Which supplier, A or B, should the chain get chickens from in order to avoid toohigh a level of arsenic?
Chapter 13 Solutions
Essentials Of Statistics For Business & Economics
Ch. 13.2 - The following data are from a completely...Ch. 13.2 - 2. In a completely randomized design, seven...Ch. 13.2 - 3. Refer to exercise 2.
what hypotheses are...Ch. 13.2 - 4. In an experiment designed to test the output...Ch. 13.2 - 5. In a completely randomized design, 12...Ch. 13.2 - Develop the analysis of variance computations for...Ch. 13.2 - 7. Three different methods for assembling a...Ch. 13.2 - 8. Refer to the NCP data in Table 13.4. Set up the...Ch. 13.2 - To study the effect of temperature on yield in a...Ch. 13.2 - Prob. 10E
Ch. 13.2 - Paint-Drying Robots. How long it takes paint to...Ch. 13.2 - Restaurant Satisfaction. The Consumer Reports...Ch. 13.3 - The following data are from a completely...Ch. 13.3 - The following data are from a completely...Ch. 13.3 - Testing Chemical Processes. To test whether the...Ch. 13.3 - Confidence Intervals for Different Processes....Ch. 13.3 - Marketing Ethics. In the digital age of marketing,...Ch. 13.3 - Machine Breakdowns. To test for any significant...Ch. 13.3 - Testing Time to Breakdown Between All Pairs of...Ch. 13.3 - Minor league Baseball Attendance. The...Ch. 13.4 - Consider the experimental results for the...Ch. 13.4 - Prob. 22ECh. 13.4 - An experiment has been conducted for four...Ch. 13.4 - Auto Tune-Ups. An automobile dealer conducted a...Ch. 13.4 - Airfares on Travel Websites. Are there differences...Ch. 13.4 - SAT Performance. The Scholastic Aptitude Test...Ch. 13.4 - Consumer Preferences. In 2018, consumer goods...Ch. 13.5 - A factorial experiment involving two levels of...Ch. 13.5 - The calculations for a factorial experiment...Ch. 13.5 - Mobile App Website Design. Based on a 2018 study,...Ch. 13.5 - Amusement Park Queues. An amusement park studied...Ch. 13.5 - Auto Fuel Efficiency. As part of a study designed...Ch. 13.5 - Tax Research. A study reported in The Accounting...Ch. 13 - Paper Towel Absorption. In a completely randomized...Ch. 13 - Job Satisfaction. A study reported in the Journal...Ch. 13 - Prob. 36SECh. 13 - College Attendance Rates. The following data show...Ch. 13 - Assembly Methods. Three different assembly methods...Ch. 13 - Job Automation. A Pew Research study conducted in...Ch. 13 - Fuel Efficiency of Gasoline Brands. A research...Ch. 13 - Late-Night Talk Show Viewership. Jimmy Kimmel...Ch. 13 - Golf Club Design. A major manufacturer of golf...Ch. 13 - Language Translation. A factorial experiment was...Ch. 13 - Defective Parts. A manufacturing company designed...Ch. 13 - CASE PROBLEM 1: WENTWORTH MEDICAL CENTER As part...Ch. 13 - CASE PROBLEM 2: COMPENSATION FOR SALES...Ch. 13 - TOURISTOPIA TRAVEL TourisTopia Travel (Triple T)...
Knowledge Booster


Learn more about
Need a deep-dive on the concept behind this application? Look no further. Learn more about this topic, statistics and related others by exploring similar questions and additional content below.Similar questions
- A random sample of 54 students from Cabrillo College are selected from a normal population with mu equal to 20 and sigma equal to 5. After a treatment is administered to the students, the researcher calculated the sample mean to be 21. Is there enough evidence to conclude that the treatment had an effect at the 5% significance level? In step three, can we use the Critical Value Method? (a)Don't know (b)Cannot Determine (c)No (d)Yesarrow_forwardA national manufacturer of ball bearings is experimenting with two different processes for producing precision ball bearings. It is important that the diameters be as close as possible to an industry standard. The output from each process is sampled and the average error from the industry standard is calculated. The results are presented below. Process A Process B Mean 0.002mm 0.0026mm Standard Deviation 0.0001mm 0.00012mm Sample Size 12 14 The researcher is interested in determining whether there is evidence that the two processes yields different average errors from the industry standard. Assume calculated t to be +2.70, at the 0.01 level of significance what would be the decision? Reject the null…arrow_forwardCans of LaCroix are supposed to contain 355 milliliters (ml). There is some variation for each can because the filling machinery is not perfectly precise. An inspector measures the contents (in ml) of 12 randomly selected cans from a single day's production. x = 352.9 Sx=2.19 Do these data provide convincing evidence at the a = 0.01 significance level that the mean amount of LaCroix in all the cans filled that day is less than the target value of 355 ml? (6pt) STATE: State hypotheses, parameters), significance level, and evidence for Ha Parameter: Statistic: Hypotheses: Significance level: Evidence for Ha: (mean less than sample) (2pt) PLAN: Identify the appropriate inference method and check conditions. Name of procedure: Check conditions: Random Sample: Normal / Large Sample: Describe what is shown.arrow_forward
- A food delivery company making a large number of deliveries would like to keep their costs down; the manager sets a goal of attaining an average fuel efficiency greater than 26 miles per gallon for all of their deliveries. To check if their goal has been met, a random sample of 42 randomly chosen company deliveries was taken, yielding a mean of 27 mpg.(a) Which hypotheses should be tested in order to determine if their fuel efficiency goal has been met?H0: Ha: (b) The test statistic is 1.5361. What is the p-value? (Use 4 decimals.) (c) Should the company conclude their fuel efficiency goal has been met, for ? = 0.05? (No, Yes) , there is (insufficient, sufficient) evidence to conclude the average fuel efficiency for all of their deliveries is (equal to, greater than) 26 mpg.(d) Suppose the company took a larger sample size.How would this affect the standard error and test statistic?A larger sample size would result in a (smaller, larger) standard error, and a (larger, smaller) test…arrow_forwardWhen you reject the null hypothesis, you: a. conclude that the differences you observe are not significant in statistical sense b. conclude that sampling error is responsible for your obtained difference c. have obtained a t-value greater than your critical t d. have committed a Type I errorarrow_forwardWith an automobile mobing 30 mph, the mean stopping distance has been 65 inches. A new break system has been developed--determine if the new system is more effective than the old. Take n=64 observations, the sample mean is 63.5 inches. Assume sigma is known and the same as the old at 4 inches. a. Set up HO and HA b. Identify type 1 and type 2 errors and the potential costs of making each. Which error is worse? what level of alpha would you select? c. Test at the .05 level. Show all stepsarrow_forward
- Which best illustrates the distinction between statistical significance and practical importance? a. This year, 360 of 440 statistics students at Oxnard Technical College rented their textbooks, compared with 110 of 330 students last year. This is a significant increase. b. Our new manufacturing technique has increased the life of the 80 GB USB AsimoDrive external hard disk significantly, from 240,000 hours to 250,000 hours. c. In 50,000 births, the new vaccine reduced the incidence of infant mortality in Morrovia significantly from 14.2 deaths per 1000 births to 10.3 deaths per 1000 births d. The new Sky Penetrator IV business jets cruising range has increased significantly from 3,975 miles to 4,000 miles.arrow_forwardUse the data in picture to test Nabisco's “Chips Ahoy! 1,000 Chips Challenge.” a. Calculate the mean X ¯ and standard deviation (s) of the sample of bags of cookies. b. State the null and alternative hypotheses (H0 and H1 ) (allow for the possibility that the number of chips may either be less or greater than that claimed by Nabisco). c. Make a decision about the null hypothesis. 1. Calculate the degrees of freedom (df). 2. Set alpha (α), identify the critical values (draw the distribution), and state 429 a decision rule. 3. Calculate a statistic: t-test for one mean. 4. Make a decision whether to reject the null hypothesis. 5. Determine the level of significance. d. Draw a conclusion from the analysis. e. What are the implications of this analysis for those who disbelieve Nabisco's claim?arrow_forwardAn experiment was carried out to compares the time (in hours) it takes an engine to run on five (5) liters of petrol. Three makes of engine of the same capacity and running at the same speed were used in the experiment. The resulting data is given in the table below. ENGINE MAKE 12.5 11.5 17.5 13.0 12.3 18.0 12.4 13.0 17.3 13.1 13.2 18.2 What is the experimental design? Which are the treatments? Carry out the appropriate analysis and test the null hypothesis at 5% level of significance. Obtain the 95% confidence interval for engine make C.arrow_forward
- What is the optimal time for a scuba diver to be on the bottom of the ocean? That depends on the depth of the dive. The US navy has done a lot of research on this topic. The navy defines the "optimal time" to be the time at each depth for the best balance between length of work period and decompression time after surfacing. Let x= depth of dive in meters and let y= optimal time in hours. A random sample of divers gave the following data. x 16.1 25.3 29.2 38.3 51.3 20.5 22.7 y 2.68 2.28 1.68 1.03 .75 2.38 2.20 find the following. Σx= ΣY= Σx2=ΣY2=Σxy=r= (round r to three decimal places) use a 1% level of significance to test the claim that p<0. (Round your answers to two decimal places) t=critical t= Find Se, a and b. (Round your answers to five decimal places)arrow_forwardWhat is the optimal time for a scuba diver to be on the bottom of the ocean? That depends on the depth of the dive. The US navy has done a lot of research on this topic. The navy defines the "optimal time" to be the time at each depth for the best balance between length of work period and decompression time after surfacing. Let x= depth of dive in meters and let y= optimal time in hours. A random sample of divers gave the following data. x 16.1 25.3 29.2 38.3 51.3 20.5 22.7 y 2.68 2.28 1.68 1.03 .75 2.38 2.20 find the predicted optimal time in hours for a dive depth of x=33 meters.(round your answer to two decimal places) __hr find an 80% confidence interval for y when x =33 meters.(round your answer to two decimal places) lower limit=upper limit= use a 1% level of significance to test the claim that b<0. (Round two decimal places) t=critical t = find a 90% confidence interval for b and interpret its meaning. (Round threee decimal places) lower limit=upper limit=arrow_forwardWhat is the optimal time for a scuba diver to be on the bottom of the ocean? That depends on the depth of the dive. The US navy has done a lot of research on this topic. The navy defines the "optimal time" to be the time at each depth for the best balance between length of work period and decompression time after surfacing. Let x= depth of dive in meters and let y= optimal time in hours. A random sample of divers gave the following data. x 16.1 25.3 29.2 38.3 51.3 20.5 22.7 y 2.68 2.28 1.68 1.03 .75 2.38 2.20 find the following. Σx= ΣY= Σx2=ΣY2=Σxy=r= (round r to three decimal places) use a 1% level of significance to test the claim that p<0. (Round your answers to two decimal places) t=critical t= Find Se, a and b. (Round your answers to five decimal places) find the predicted optimal time in hours for a dive depth of x=33 meters.(round your answer to two decimal places) __hr find an 80% confidence interval for y when x =33 meters.(round your answer to two decimal places)…arrow_forward
arrow_back_ios
SEE MORE QUESTIONS
arrow_forward_ios
Recommended textbooks for you
 MATLAB: An Introduction with ApplicationsStatisticsISBN:9781119256830Author:Amos GilatPublisher:John Wiley & Sons Inc
 Probability and Statistics for Engineering and th...StatisticsISBN:9781305251809Author:Jay L. DevorePublisher:Cengage Learning
 Statistics for The Behavioral Sciences (MindTap C...StatisticsISBN:9781305504912Author:Frederick J Gravetter, Larry B. WallnauPublisher:Cengage Learning
 Elementary Statistics: Picturing the World (7th E...StatisticsISBN:9780134683416Author:Ron Larson, Betsy FarberPublisher:PEARSON
 The Basic Practice of StatisticsStatisticsISBN:9781319042578Author:David S. Moore, William I. Notz, Michael A. FlignerPublisher:W. H. Freeman
 Introduction to the Practice of StatisticsStatisticsISBN:9781319013387Author:David S. Moore, George P. McCabe, Bruce A. CraigPublisher:W. H. Freeman
MATLAB: An Introduction with Applications
Statistics
ISBN:9781119256830
Author:Amos Gilat
Publisher:John Wiley & Sons Inc
Probability and Statistics for Engineering and th...
Statistics
ISBN:9781305251809
Author:Jay L. Devore
Publisher:Cengage Learning
Statistics for The Behavioral Sciences (MindTap C...
Statistics
ISBN:9781305504912
Author:Frederick J Gravetter, Larry B. Wallnau
Publisher:Cengage Learning
Elementary Statistics: Picturing the World (7th E...
Statistics
ISBN:9780134683416
Author:Ron Larson, Betsy Farber
Publisher:PEARSON
The Basic Practice of Statistics
Statistics
ISBN:9781319042578
Author:David S. Moore, William I. Notz, Michael A. Fligner
Publisher:W. H. Freeman
Introduction to the Practice of Statistics
Statistics
ISBN:9781319013387
Author:David S. Moore, George P. McCabe, Bruce A. Craig
Publisher:W. H. Freeman
Hypothesis Testing using Confidence Interval Approach; Author: BUM2413 Applied Statistics UMP;https://www.youtube.com/watch?v=Hq1l3e9pLyY;License: Standard YouTube License, CC-BY
Hypothesis Testing - Difference of Two Means - Student's -Distribution & Normal Distribution; Author: The Organic Chemistry Tutor;https://www.youtube.com/watch?v=UcZwyzwWU7o;License: Standard Youtube License