Consumer Preferences. In 2018, consumer goods giant Procter and Gamble (P&G) had more than 20 brands with more than $1 billion in annual sales (P&G website, https://us.pg.com/). How does a company like P&G create so many successful consumer products? P&G effectively invests in research and development to understand what consumers want. One method used to determine consumer preferences is called conjoint analysis. Conjoint analysis allows a company to ascertain the utility that a respondent in the conjoint study places on a design of a given product. The higher the utility, the more valuable a respondent finds the design. Suppose we have conducted a conjoint study and have the following estimated utilities (higher is preferred) for each of three different designs for a new whitening toothpaste.
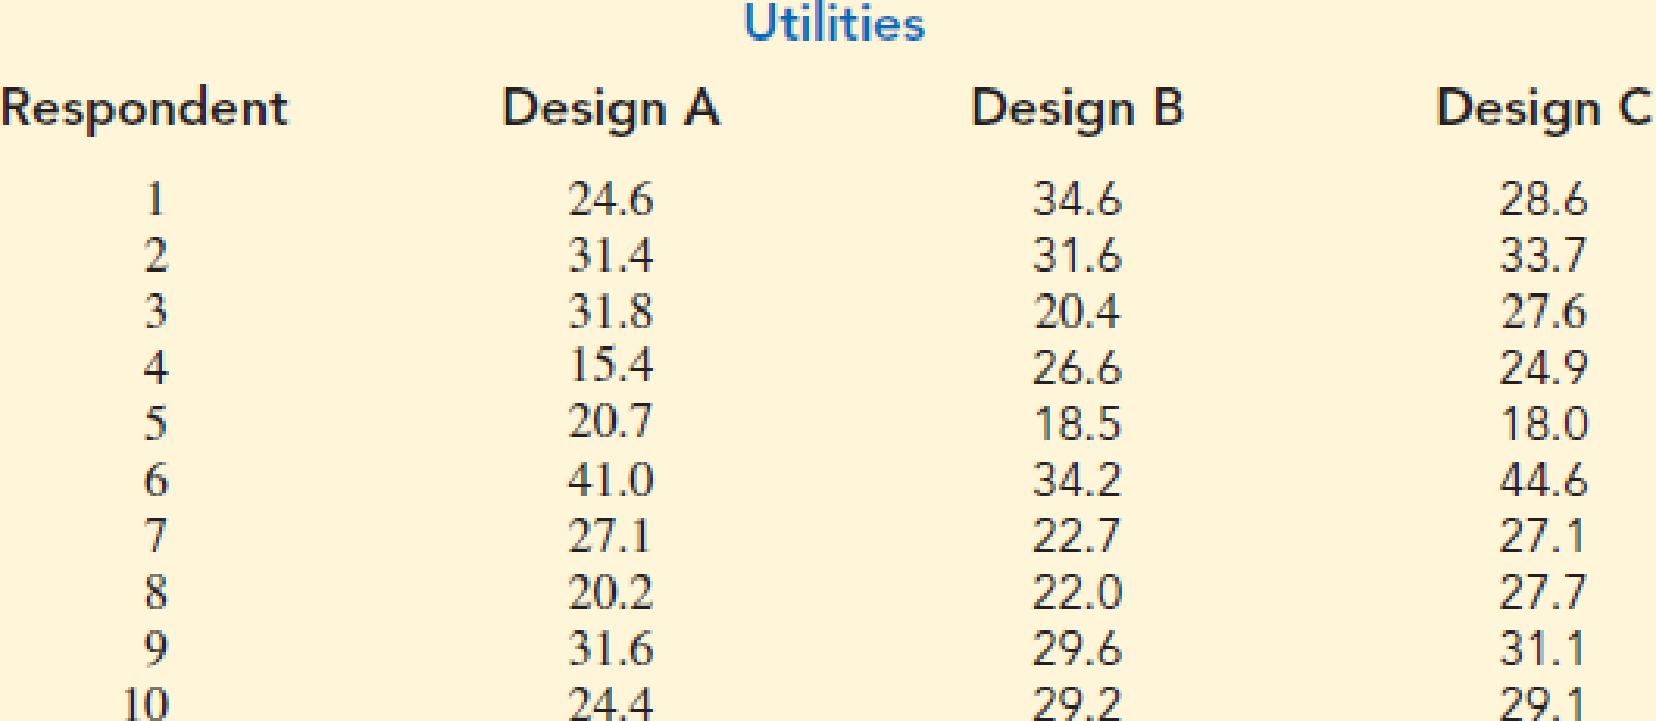
At the .05 level of significance, test for any significant differences.

Trending nowThis is a popular solution!

Chapter 13 Solutions
Essentials Of Statistics For Business & Economics
- In a bowling tournament, a team has won 15 of its last 20 games. Based on this information, what is the probability that it will win: a) at least 4 of the remaining 10? b) exactly 4 of the remaining 10? c) more than 4 of its remaining 10? d) Construct a graph of the probability distribution.arrow_forwardDetermine whether a probability distribution exists. If a probability distribution exists, find its mean and standard deviation. If a probability distribution does not exist, identify the requirements that are not met. Fun Ways to Flirt A sociologist randomly selects single adults into groups of three, and the random variable x is the number of people in the group who say the most fun way to flirt is in person (based on a Microsoft instant messenger survey). P(x) 0 0.091 1 0.334 2 0.408 3 0.166arrow_forwardDetermine whether a probability distribution exists. If a probability distribution exists, find its mean and standard deviation. If a probability distribution does not exist, identify the requirements that are not met. Fun Ways to Flirt In a Microsoft Instant Messenger survey, respondents were asked to choose the funniest way to flirt, and the attached table is based on the results. P(x) Email 0.06 In person 0.55 Instant message 0.24 Text message 0.15arrow_forward
- In an electrical products industry, as part of a quality control test, a batch of 300 electrical fuses is selected, which is known to contain 5% defective fuses. A sample of 5 fuses is taken to verify their condition. Determine the probability that: a) One fuse is defective b) Two fuses are defective c) At least one is defective d) All five are defective e) Construct the probability distribution grapharrow_forwardAnswer the problem please.arrow_forwardcan wr define each section pleasearrow_forward
- A number of years ago, there was a popular television game show called Let's Make a Deal. The host, Monty Hall, would randomly select contestants from the audience and, as the title suggests, he would make deals for prizes. Contestants would be given relatively modest prizes and then would be offered the opportunity to risk that prize to win better ones. Suppose a contestant on this show, On the stage are three curtains, A, B, and C. Behind one of them is a brand-new car worth $45,000. Behind the other two curtains, the stage is empty.mthey must now select one of the curtains. Suppose you select Curtain A.In an attempt to make things more interesting, Monty then exposes an empty stage by opening Curtain C (note: he knows that there is nothing behind Curtain C). He then asks if they want to keep Curtain A, or switch to Curtain B.What should they do? Keep Curtain A or switch to Curtain B?arrow_forward> than m... 1/5 Saray A binomial experiment with probability of success p=0.16 and = 7 trials is conducted. What is the probability that the experiment results in more than 1 success? Do not round your intermediate computations, and round your answer to three decimal places. (If necessary, consult a list of formulas.) o search E C 105°F E Explanation Check 2025 McGraw Hill LLC. All Rights Reserved. Terms of Use | Privacy Center | Accessibilityarrow_forwardfind an article that includes a reference to the use of probability in a real life situation. These articles/videos might be discussing weather events, investing outcomes, or sports performance, among many other possible topicsarrow_forward
- Good Day, Kindly assist with this query. Any assistance would be appreciated. Compute R2 Is the latter significant different from zero?arrow_forwardThe following table describes the probability distribution of the number of Mexican-Americans serving on a 12-member jury in Hidalgo County, Texas. Assuming we repeat the random selection process for the 12 jurors and count the number of Mexican-Americans each time, calculate the mean number of Mexican-Americans (out of 12), the variance, and the standard deviation. Use these results and the interval rule of thumb to calculate the highest common value and the lowest common value. Based on the results, determine whether a jury consisting of 7 Mexican-Americans out of 12 jurors is common or uncommon. Probability distribution: probabilities of numbers of Mexican-Americans on a 12-member jury, assuming the members are randomly selected from a population in which 80% of the inhabitants are Mexican-American x (méxico- estadouni- P(x) denses) 0 0+ 1 0+ 2 0+ 3 0+ 4 0.001 5 0.003 6 0.016 7 0.053 8 0.133 9 0.236 10 0.283 11 0.206 12 0.069arrow_forwarda) When two variables are correlated, can the researcher be sure that one variable causes the other? If YES , why? If NO , why? b) What is meant by the statement that two variables are related? Discuss with examples.arrow_forward
- MATLAB: An Introduction with ApplicationsStatisticsISBN:9781119256830Author:Amos GilatPublisher:John Wiley & Sons IncProbability and Statistics for Engineering and th...StatisticsISBN:9781305251809Author:Jay L. DevorePublisher:Cengage LearningStatistics for The Behavioral Sciences (MindTap C...StatisticsISBN:9781305504912Author:Frederick J Gravetter, Larry B. WallnauPublisher:Cengage Learning
- Elementary Statistics: Picturing the World (7th E...StatisticsISBN:9780134683416Author:Ron Larson, Betsy FarberPublisher:PEARSONThe Basic Practice of StatisticsStatisticsISBN:9781319042578Author:David S. Moore, William I. Notz, Michael A. FlignerPublisher:W. H. FreemanIntroduction to the Practice of StatisticsStatisticsISBN:9781319013387Author:David S. Moore, George P. McCabe, Bruce A. CraigPublisher:W. H. Freeman


