
Concept explainers
Videos
Refer to Exercise 13.46. Construct a 95% confidence interval for the difference in the mean distance of roll when Dasher ryegrass and Marvelgreen supreme are used for overseeding.
13.46 A. E. Dudeck and C. H. Peacock report on an experiment conducted to evaluate the performance of several cool-season grasses for winter overseeding of golf greens in northern Florida. One of the variables of interest was the distance that a golf ball would roll on a green after being rolled down a ramp (used to induce a constant initial velocity to the ball). Because the distance that the ball would roll was influenced by the slope of the green and the direction in which the grass was mowed, the experiment was set up in a randomized block design. The blocks were determined so that the slopes of the individual plots were constant within blocks (a transit was used to ensure accuracy), and all plots were mowed in the same direction and at the same height to eliminate mowing effects. The base grass was “Tiftgreen” Bermuda grass in a semidormant state. The same method of seeding and rates of application were used for all the ryegrasses that are represented in the following table of data. Measurements are average distances (in meters) from the base of the ramp to the stopping points for five balls rolled down the ramp and directly up the slope on each plot. Cultivars used in the study included A (Pennfine ryegrass), B (Dasher ryegrass), C (Regal ryegrass), D (Marvelgreen supreme), and E (Barry ryegrass). The grasses were planted within blocks and yielded the measurements shown.7
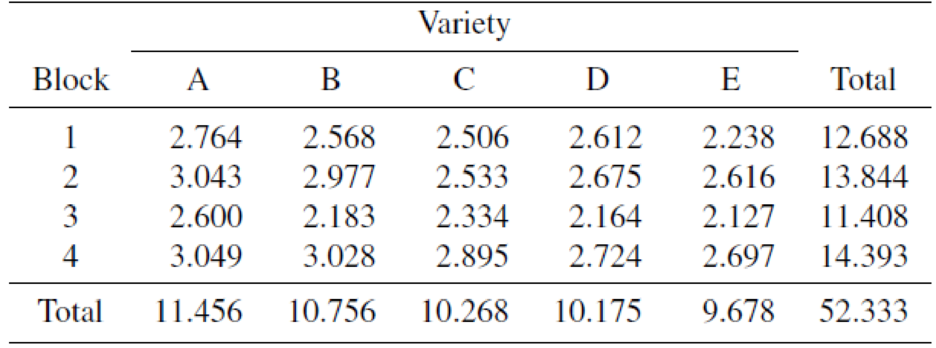
a Perform the appropriate ANOVA to test for sufficient evidence to indicate that the mean distance of ball roll differs for the five cultivars. Give bounds for the attained significance level. What would you conclude at the α = .01 level of significance?
b Is there evidence of a significant difference between the blocks used in the experiment? Test using α = .05.
Want to see the full answer?
Check out a sample textbook solution
Chapter 13 Solutions
Mathematical Statistics with Applications


- 1. A recent survey showed that from a sample of 500 packages delivered by a Postal Service, 480were delivered on time. a) Construct a 95% confidence interval for the proportion of all packages that are deliveredon time by the Postal Service.arrow_forwardThe management of a large national chain of 20 motels, each with 100 rooms, decided to estimate the mean cost per room of repairing damages made by its customers . A random sample of 31 vacated rooms was inspected by the management and indicated a mean repair cost Of tilde x =\$28.10 and a sample standard deviation of s=\$12.40 . Construct a 95\% confidence interval for the mean repair cost u for the 2000 motel rooms .arrow_forwardA researcher surveys 50 individuals in Smithville and 40 in Amherst, finding that 30% of smithville residents moved last year, while only 22% of Amherst residents did. Is there enough evidence to conclude that mobility rates in the two communities differ? Use a two-tailored alternative, and a=0.10. Again, find the p-value and a 90% confidence interval for the difference in proportionsarrow_forward
- The following are body mass index (BMI) scores measured in 12 patients who are free of diabetes and are participating in a study of risk factors for obesity. Body mass index is measured as the ratio of weight in kilograms to height in meters squared. Generate a 95% confidence interval estimate of the true BMI. 25 27 31 33 26 28 38 41 24 32 35 40arrow_forwardA research group studying cell phone habits asked the question “Do you ever use your cell phone to make a payment at a convenience store?” to people selected from two random samples of cell phone users. One sample consisted of older adults, ages 35 years and older, and the other sample consisted of younger adults, ages 18 years to 34 years. The proportion of people who answered yes in each sample was used to create a 95 percent confidence interval of (0.097,0.125)(0.097,0.125) to estimate the difference (younger minus older) between the population proportions of people who would answer yes to the question. Which of the following is the best description of what is meant by 95 percent confidence? In repeated random sampling with the same sample size, approximately 95% of the sample proportions from the younger group will be between 0.097 and 0.125 greater than the sample proportion from the older group. A In repeated random sampling with the same sample size,…arrow_forwardA medical doctor who wanted to study the heights of adult men and women took a random sample of 150 adult men and 120 adult women and found the following summary results. Mean Height Standard Deviation Adult Men 170cm 8cm Adult Women 164cm 6cm Find a 90% confidence interval for the difference of mean height of adult men and women.arrow_forward
- The business manager of a local health clinic is interested in estimating the difference between the fees for extended office visits in her center and the fees of a newly opened group practice. She gathered the following information regarding the two offices. Health Clinic Group Practice Sample size 50 visits 45 visits Sample mean $21 $19 Population Standard deviation $2.75 $3.00 a. What is your conclusion? Use a= 0.05. b. Develop a 95% confidence interval estimate for the difference between the average fees of the two offices.arrow_forwardThe final exam score was recorded for each Harper statistics student in a sample of 30. A 95% confidence interval forarrow_forward
 Glencoe Algebra 1, Student Edition, 9780079039897...AlgebraISBN:9780079039897Author:CarterPublisher:McGraw Hill