
Videos
Refer to Exercise 13.45. Answer part (b) by constructing an F test, using complete and reduced linear models.
13.45 An experiment was conducted to determine the effect of three methods of soil preparation on the first-year growth of slash pine seedlings. Four locations (state forest lands) were selected, and each location was divided into three plots. Because soil fertility within a location was likely to be more homogeneous than between locations, a randomized block design was employed, using locations as blocks. The methods of soil preparation were A (no preparation), B (light fertilization), and C (burning). Each soil preparation was randomly applied to a plot within each location. On each plot the same number of seedlings was planted, and the observation recorded was the average first-year growth (in centimeters) of the seedlings on each plot. These observations are reproduced in the accompanying table.
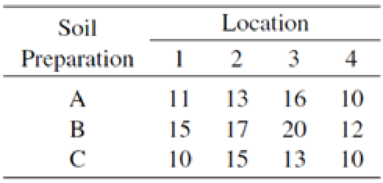
- a Conduct an ANOVA. Do the data provide sufficient evidence to indicate differences in the mean growth for the three soil preparations?
- b Is there evidence to indicate differences in mean growth for the four locations?
Want to see the full answer?
Check out a sample textbook solution
Chapter 13 Solutions
Mathematical Statistics with Applications


- A researcher developed a regression model to predict the cost of a meal based on the summated rating (sum of ratings for food, decor,and service) and the cost per meal for 12 restaurants. The results of the study show that b1=1.4379 and Sb1=0.1397. a. At the 0.05 level of significance, is there evidence of a linear relationship between the summated rating of a restaurant and the cost of a meal? b. Construct a 95% confidence interval estimate of the population slope, β1. a. Determine the hypotheses for the test. Choose the correct answer below. A. H0: β1=0 H1: β1≠0 B. H0: β0≤0 H1: β0>0 C. H0: β1≤0 H1: β1>0 D. H0: β0≥0 H1: β0<0 E. H0: β1≥0 H1: β1<0 F. H0: β0=0 H1: β0≠0 Compute the test statistic. The test statistic is ? (Round to two decimal places as needed.) Determine the critical value(s). The critical value(s) is(are) ? (Use a comma to separate answers as needed.…arrow_forwardInterpret the following three sets of data using scatter chart and regression analysis, using slope , intercept, Coefficient of Determiniation (R2) , regression data (using excel), and 95% confidence interval Generate and explain the derivation of insights using regression analysis and its associated visualization. Differentiate between the signals identified by business analytics and the noise that is inherent in the system. 1. C16 (number of cars on the sales lot) versus Y: C17 (cars sold per day) C16 5 10 20 8 4 6 12 15 C17 27 46 73 40 30 28 46 59arrow_forwardThe director of an obesity clinic in a large northwestern city believes that drinking soft drinks contribute to obesity in children. To determine whether a relationship exists between these two variables, she conducts the following pilot study. Eight- 12-year-old male volunteers are randomly selected from children attending a local junior high school. Parents of the children are asked to monitor the number of soft drinks consumed by their child over a one week period. The children are weighed at the end of the week and their weights converted into body mass index (BMI) values. The BMI is a common index used to measure obesity and takes into account both height and weight. An individual is considered obese if they have a BMI value 30. The following data or collected: child. # of soft drinks consumed BMI 1 3 20 2 1 18 3…arrow_forward
- The table below shows the numbers of bushels of barley cultivated per acre for 12 one-acre plots of land for two different strains of barley, PHT-34 and CBX-21. PHT-34 CBX-21 43 55 49 46 47 43 38 44 47 45 45 49 50 47 46 59 46 52 46 49 45 48 43 51 Determine the minimum data value, the quartiles, and the maximum data value for the PHT-34 and CBX-21 data sets. PHT-34 CBX-21 min Q1 Q2 Q3 maxarrow_forwardThe researchers reported:" A 2x2 ANOVA revealed, first of all, a main effect for depletion, indicating that depleted individuals generated less ideas (M = 9.40, SD = 5.64) than non-depleted individuals (M = 12.44, SD = 7.34), F (1, 108) = 6.03, p = .016, n2 = .05. This effect was qualified by the expected interaction with [perseverance], F (1,108) = 4.52, p = .036, n2 = .05". What size are the effects for the main effect of depletion and for the interaction between depletion and perseverance, according to Cohen's conventions? a. These are small- to -medium effects b. These are non existent effects c. These are large effects d. We are unable to tell from from the n2 / r2 statisticsarrow_forwardconsider the coefficient estimates of the following market model linear regression of general motors (gm) on the S&P500 market returns coefficient estimate std error tvalue pr(>ItI) intercept 0.005860 0.0003704 1.582 0.12412 sp500 0.0904753 0.266702 3.392 0.00196 The number of observations is 32.At the 1% significance level, what is the (1)test statistic value,(2) the critical values (3) decision regarding the null hypothesis that the beta coefficient on the market returns is equal to 1.61arrow_forward
- Interpret the following three sets of data using scatter chart and regression analysis, using slope , intercept, Coefficient of Determiniation (R2) , regression data (using excel), and 95% confidence interval Generate and explain the derivation of insights using regression analysis and its associated visualization. Differentiate between the signals identified by business analytics and the noise that is inherent in the system. 1.C20 (annual number of training hours) versus Y: C21 (time to serve customers in minutes) C20 100 100 100 100 100 125 125 125 125 150 150 150 150 150 175 175 175 175 C21 21.8 21.9 21.7 21.6 21.7 21.7 21.4 21.5 21.4 21.9 21.8 21.8 21.6 21.5 21.9 21.7 21.8 21.4arrow_forwardA survey of high school students was done to examine whether students had ever driven a car after consuming a substantial amount of alcohol (1=yes, 0=no). Data was collected on their sex (male/female), race (White/non-White), and grade level (9,10,11,12). Researchers realized that the impact of race on consuming alcohol before driving might vary by grade level and decided to fit the following model. Variable Coding = 1 if Intercept Sex () Female Race () Black Grade level ( 9th grade 10th grade 11th grade [Reference = 12th grade] Attached is the logistic model 1. Compute the OR of drinking before driving for students who self-reported as Black versus non-Black in the 9th grade, adjusting for gender. 2. Compute the OR of drinking before driving for students who self-reported as Black versus non-Black in the 12th grade, adjusting for gender. 3. Compute the OR of drinking before driving for someone in the 9th grade versus 12th grade for a student who…arrow_forwardAn article included a summary of findings regarding the use of SAT I scores, SAT II scores, and high school grade point average (GPA) to predict first-year college GPA. The article states that "among these, SAT II scores are the best predictor, explaining 17 percent of the variance in first-year college grades. GPA was second at 15.2 percent, and SAT I was last at 13.1 percent." If the data from this study were used to fit a least squares line with y = first-year college GPA and x = high school GPA, what would the value of r2 have been? R2 ____________________%arrow_forward
- Following are the protein contents measured in two types of species:Species 1: 0.72 1.12 0.81 0.89 0.72 0.81 1.01 0.75 0.83Species 2: 1.21 0.93 0.80 1.12 1.22 0.94 0.87 i) Assuming normality, test the hypothesis that the two species have the sameaverage protein contents by using 5-step hypothesis testing procedure at 5 %level of significance, and using the critical values approach.ii) Calculate the p-value of this test and make decision.iii) Write down the standard error of this test and calculate its numerical value ?arrow_forward12 young batsmen practiced batting at the nets for varying periods of time, and their dot ball percentage was calculated at the end of the month: Practice time per month (in hr) 43 30 55 12 28 37 41 48 34 18 24 62 Dot ball percentage 18 29 15 54 43 24 22 16 34 56 47 13 a) Find the relationship between dot ball percentage and practice time per month using a scatter diagram and interpret. b) Find correlation coefficient and comment. c) Fit a least square regression equation (line) of dot ball percentage on practice time per month and comment. d) What will be the dot ball percentage when practice time per month is 32hr? e) Comment on the regression equation and explore how well it fits.arrow_forwardThe authors of the article “Predictive Model for PittingCorrosion in Buried Oil and Gas Pipelines”(Corrosion, 2009: 332–342) provided the data on whichtheir investigation was based.a. Consider the following sample of 61 observations onmaximum pitting depth (mm) of pipeline specimensburied in clay loam soil. 0.41 0.41 0.41 0.41 0.43 0.43 0.43 0.48 0.480.58 0.79 0.79 0.81 0.81 0.81 0.91 0.94 0.941.02 1.04 1.04 1.17 1.17 1.17 1.17 1.17 1.171.17 1.19 1.19 1.27 1.40 1.40 1.59 1.59 1.601.68 1.91 1.96 1.96 1.96 2.10 2.21 2.31 2.462.49 2.57 2.74 3.10 3.18 3.30 3.58 3.58 4.154.75 5.33 7.65 7.70 8.13 10.41 13.44Construct a stem-and-leaf display in which the twolargest values are shown in a last row labeled HI.b. Refer back to (a), and create a histogram based oneight classes with 0 as the lower limit of the firstclass and class widths of .5, .5, .5, .5, 1, 2, 5, and 5,respectively.c. The accompanying comparative boxplot fromMinitab shows plots of pitting depth for four differenttypes of soils.…arrow_forward
 MATLAB: An Introduction with ApplicationsStatisticsISBN:9781119256830Author:Amos GilatPublisher:John Wiley & Sons Inc
 Probability and Statistics for Engineering and th...StatisticsISBN:9781305251809Author:Jay L. DevorePublisher:Cengage Learning
 Statistics for The Behavioral Sciences (MindTap C...StatisticsISBN:9781305504912Author:Frederick J Gravetter, Larry B. WallnauPublisher:Cengage Learning
 Elementary Statistics: Picturing the World (7th E...StatisticsISBN:9780134683416Author:Ron Larson, Betsy FarberPublisher:PEARSON
 The Basic Practice of StatisticsStatisticsISBN:9781319042578Author:David S. Moore, William I. Notz, Michael A. FlignerPublisher:W. H. Freeman
 Introduction to the Practice of StatisticsStatisticsISBN:9781319013387Author:David S. Moore, George P. McCabe, Bruce A. CraigPublisher:W. H. Freeman