
Mathematical Statistics with Applications
7th Edition
ISBN: 9780495110811
Author: Dennis Wackerly, William Mendenhall, Richard L. Scheaffer
Publisher: Cengage Learning
expand_more
expand_more
format_list_bulleted
Videos
Textbook Question
Chapter 13.13, Problem 71E
Refer to Exercise 13.42. Answer part (a) by fitting complete and reduced models.
13.42 The accompanying table presents data on yields relating to resistance to stain for three materials (M1, M2, and M3) treated with four chemicals in a randomized block design. (A low value indicates good stain resistance.)
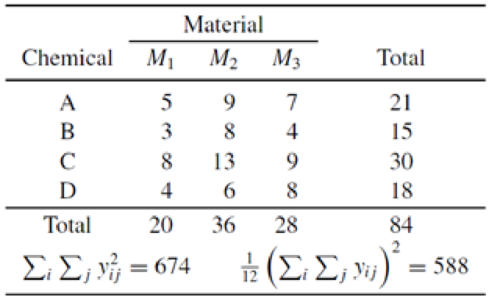
- a Is there evidence of differences in mean resistance among the four chemicals? Give bounds for the p-value.
- b What would you conclude at the α = .05 level of significance?
Expert Solution & Answer

Trending nowThis is a popular solution!

Students have asked these similar questions
1. What does it imply if if more values are concentrated above the mean? (Skewness) And would the value of skewness be less than, greater than, or equal to 0?
2. In case the data is highly skewed, can we still rely on the kurtosis coefficient? Why or why not?
3. Can the z-score be a real measure of dispersion?
If X1 and X2 constitute a random sample of size n = 2from an exponential population, find the efficiency of 2Y1relative to X, where Y1 is the first order statistic and 2Y1and X are both unbiased estimators of the parameter
The average UQ student reports dedicating 8.5 hours per week to each 2-unit course. What is the approximate t obtained value for a group of 16 psychology students who study for a mean of 9.5 hours per week for each 2-unit course, where the estimated population variance is
3.68. Would this sample be considered significantly different from the population, applying an alpha level of 0.05?
t = 0.48; the sample would be considered statistically significant t = 0.48; the sample would NOT be considered statistically
significant
t = 2.08; the sample would NOT be considered statistically significant
t = 2.08; the sample would be considered statistically significant
Chapter 13 Solutions
Mathematical Statistics with Applications
Ch. 13.2 - The reaction times for two different stimuli in a...Ch. 13.2 - Prob. 2ECh. 13.4 - State the assumptions underlying the ANOVA of a...Ch. 13.4 - Prob. 4ECh. 13.4 - Prob. 5ECh. 13.4 - Suppose that independent samples of sizes n1, n2,,...Ch. 13.4 - Four chemical plants, producing the same products...Ch. 13.4 - Prob. 8ECh. 13.4 - Prob. 9ECh. 13.4 - A clinical psychologist wished to compare three...
Ch. 13.4 - It is believed that women in the postmenopausal...Ch. 13.4 - If vegetables intended for human consumption...Ch. 13.4 - One portion of the research described in a paper...Ch. 13.4 - The Florida Game and Fish Commission desires to...Ch. 13.4 - Prob. 15ECh. 13.4 - An experiment was conducted to examine the effect...Ch. 13.5 - Prob. 17ECh. 13.5 - Refer to Exercise 13.17 and consider YiYi for i ...Ch. 13.5 - Refer to the statistical model for the one-way...Ch. 13.7 - Refer to Examples 13.2 and 13.3. a Use the portion...Ch. 13.7 - Refer to Examples 13.2 and 13.4. a Use the portion...Ch. 13.7 - a Based on your answers to Exercises 13.20 and...Ch. 13.7 - Refer to Exercise 13.7. a Construct a 95%...Ch. 13.7 - Prob. 24ECh. 13.7 - Prob. 25ECh. 13.7 - Prob. 26ECh. 13.7 - Prob. 27ECh. 13.7 - Prob. 28ECh. 13.7 - Prob. 29ECh. 13.7 - Prob. 30ECh. 13.7 - Prob. 31ECh. 13.7 - Prob. 32ECh. 13.7 - Prob. 33ECh. 13.7 - Prob. 34ECh. 13.7 - Prob. 35ECh. 13.8 - Prob. 36ECh. 13.8 - Prob. 37ECh. 13.8 - Prob. 38ECh. 13.8 - Prob. 39ECh. 13.8 - Prob. 40ECh. 13.9 - Prob. 41ECh. 13.9 - The accompanying table presents data on yields...Ch. 13.9 - Refer to Exercise 13.42. Why was a randomized...Ch. 13.9 - Prob. 44ECh. 13.9 - Prob. 45ECh. 13.9 - Prob. 46ECh. 13.9 - Prob. 47ECh. 13.9 - Prob. 48ECh. 13.9 - Prob. 49ECh. 13.9 - Prob. 50ECh. 13.9 - Prob. 51ECh. 13.10 - Prob. 52ECh. 13.10 - Prob. 53ECh. 13.10 - Prob. 54ECh. 13.10 - Refer to Exercise 13.46. Construct a 95%...Ch. 13.10 - Prob. 56ECh. 13.10 - Prob. 57ECh. 13.11 - Prob. 58ECh. 13.11 - Prob. 59ECh. 13.11 - Prob. 60ECh. 13.11 - Prob. 61ECh. 13.11 - Prob. 62ECh. 13.12 - Prob. 63ECh. 13.12 - Prob. 64ECh. 13.12 - Prob. 65ECh. 13.12 - Prob. 66ECh. 13.12 - Prob. 67ECh. 13.12 - Prob. 68ECh. 13.13 - Prob. 69ECh. 13.13 - Prob. 70ECh. 13.13 - Refer to Exercise 13.42. Answer part (a) by...Ch. 13.13 - Refer to Exercise 13.45. Answer part (b) by...Ch. 13 - Prob. 73SECh. 13 - Prob. 74SECh. 13 - Prob. 75SECh. 13 - Prob. 77SECh. 13 - A study was initiated to investigate the effect of...Ch. 13 - Prob. 79SECh. 13 - A dealer has in stock three cars (models A, B, and...Ch. 13 - In the hope of attracting more riders, a city...Ch. 13 - Prob. 84SECh. 13 - Prob. 85SECh. 13 - Prob. 86SECh. 13 - Prob. 87SECh. 13 - Prob. 88SECh. 13 - Prob. 89SECh. 13 - Prob. 90SECh. 13 - Prob. 92SECh. 13 - Prob. 94SE
Knowledge Booster


Learn more about
Need a deep-dive on the concept behind this application? Look no further. Learn more about this topic, statistics and related others by exploring similar questions and additional content below.Similar questions
- A snack food manufacturer estimates that the variance of the number of grams of carbohydrates in servings of its tortilla chips is 1.33. A dietician is asked to test this claim and finds that a random sample of 24 servings has a variance of 1.37. At α=0.01, is there enough evidence to reject the manufacturer's claim? Assume the population is normally distributed. Complete parts (a) through (e) below. (a) Write the claim mathematically and identify H0 and Ha. A. H0: σ2≤1.33 (Claim) Ha: σ2>1.33 B. H0: σ2≠1.33 Ha: σ2=1.33 (Claim) C. H0: σ2≥1.33 Ha: σ2<1.33 (Claim) D. H0: σ2=1.33 (Claim) Ha: σ2≠1.33 (b) Find the critical value(s) and identify the rejection region(s). The critical value(s) is(are) enter your response here. (Round to two decimal places as needed. Use a comma to separate answers as needed.) Choose the correct statement below and fill in the corresponding answer boxes. A. The…arrow_forwardIf the value of Cronbach’s alpha is 0.07, it means ___________; a. Research instrument is not reliable b. Research instrument is internally consistent c. Data is reliable d. Data is internally consistentarrow_forwardNote- bolded quiz have already answered A possible important environmental determinant of lung function in children is the amount of cigarette smoking in the home. Suppose this question is studied by selecting two groups: Group 1 consists of 23 nonsmoking children 5-9 years of age, both of whose parents smoke, who have a mean forced expiratory volume (FEV) of 2.1 L and a standard deviation of 0.7 L; group 2 consists of 20 nonsmoking children of comparable age, neither of whose parents smoke, who have a mean FEV of 2.3 L and a standard deviation of 0.4 L.*8.31 What are the appropriate null and alternative hypotheses to compare the means of the two groups? *8.32 What is the appropriate test procedure for the hypotheses in Problem 8.31? *8.33 Carry out the test in Problem 8.32 using the criticalvalue method. *8.34 Provide a 95% CI for the true mean difference in FEV between 5- to 9-year-old children whose parents smoke and comparable children whose parents do not smoke. *8.35 Assuming…arrow_forward
- The Road Department is trying to see whether they should buy road treatments ( in tons) for storms based on the number of inches of snow for each recorded. Use Pearson r at alpha- 0.05 to test the hypothesis. ILLUSTRATE THE NORMAL CURVE inches in snow 1.5 1.7 3.7 2.8 4.6 2.4 3.1 2.9 3.6 4.2 3.1 number of tons 805 905 1235 1000 1302 998 1102 1305 1456 1600 1005arrow_forwardA dietitian wishes to see if a person’s cholesterol level will be changed if the diet is supplemented by a certain mineral. Four subjects were pre-tested, and they took the mineral supplement for a 6-week period. The results are shown in the table. Is there sufficient evidence to conclude that the population mean of cholesterol levels has been changed after six weeks at α=0.2α=0.2? Assume that the differences are from an approximately normally distributed population. Subject Cholestrol Level (mg/dl) Cholestrol Level after 6 Weeks (mg/dl) dd ¯dd¯ (d−¯d)2(d-d¯)2 1 206 217 11 2 219 184 -35 3 202 204 2 4 213 205 -8 Total -30 a) Calculate the mean, the sum of the squared deviation from the mean, and the standard deviation of differences. Do not include the unit for each answer: ¯d=d¯= (do not round) ∑(d−¯d)2=∑(d-d¯)2= (do not round) sd=sd= (rounded to one decimal place) b) Perform the hypothesis test in the following steps: Step 1.…arrow_forwardThe following data are from a random sample of 10 students who participated in a study undertaken to investigate the effect of sleep time (measured in average number of hours of sleep per night) on GPA (grade point average, measured on a 4-point scale). Student Sleep time GPA 1 7 3.28 2 9 3.16 3 8 3.75 4 6 2.50 5 4 2.45 6 8 2.91 7 7 3.53 8 6 3.02 9 3 2.30 10 8 3.48 a. Find the equation between GPA (y) as function of sleep time (x). b. What is the estimated GPA of a student who averages 5 hours of sleep per night? c. What is the coefficient of determination? *(no use EXCEL)arrow_forward
- The test statistic of z=−2.31 is obtained when testing the claim that p=1/2. a. Using a significance level of α=0.05,find the critical value(s). b. Should we reject H0 or should we fail to reject H0?arrow_forwardA fisheries biologist collected a random sample of fish from a lake and conducted a chi-square goodness-of-fit test to see if the distribution of fish changed over time. The table below shows the distribution of fish that were put into the lake when it was originally stocked. Fish Type Trout Bass Perch Sunfish Catfish Percent 25% 25% 20% 15% 15% The biologist found evidence to reject the null hypothesis in favor of the alternative hypothesis. Which of the following represents the alternative hypothesis of the test?arrow_forwardThe NAEP considers that a national average of 283 is an acceptable performance. Using α = .05, run a two-tail t-test for one sample to test Ho: µ=283 for the 2019 scores. Report the t-obt, df, and p-values. Would you reject the null hypothesis that the 2019 scores come from a population with average 283? If this is the case, does it come from a population from larger or smaller average?arrow_forward
- The test statistic of z=−2.85 is obtained when testing the claim that p=1/2. a. Using a significance level of α=0.05, find the critical value(s). b. Should we reject H0 or should we fail to reject H0?arrow_forwardThe random sample of 7 pairs of observations from the normal population gives the following information:- x 8 1 3 6 12 7 10 y 13 30 23 35 24 18 15 [ r = -0.459 and take the significance level (alpha) = 0.02] The P - Value of the test statistic ( along with decision ) used for testing that the two variables are not linearly related ( H(null) : roll = 0) isarrow_forwardA beer store wanted to test the difference on drinking habits if a younger group of 21-30 years old (n=8) to an older group of 50 to 60 years old (n=10). The store took a survey of beers per year each person had in both groups and found the following data: 21-30 group 50-60 group 50 35 17 64 25 39 88 75 53 61 62 89 36 45 29 35 29 78 State the hypotheses of the study.b. Find the critical t value for this study at an alpha level at α=.05.c. Compute the independent t testd. If significant, perform a percentage of variance test.e. State the results in APA format (numbers and words) and don’t forget to include all parts in the sentence and the direction of the results.arrow_forward
arrow_back_ios
SEE MORE QUESTIONS
arrow_forward_ios
Recommended textbooks for you
 Glencoe Algebra 1, Student Edition, 9780079039897...AlgebraISBN:9780079039897Author:CarterPublisher:McGraw Hill
Glencoe Algebra 1, Student Edition, 9780079039897...
Algebra
ISBN:9780079039897
Author:Carter
Publisher:McGraw Hill
Hypothesis Testing using Confidence Interval Approach; Author: BUM2413 Applied Statistics UMP;https://www.youtube.com/watch?v=Hq1l3e9pLyY;License: Standard YouTube License, CC-BY
Hypothesis Testing - Difference of Two Means - Student's -Distribution & Normal Distribution; Author: The Organic Chemistry Tutor;https://www.youtube.com/watch?v=UcZwyzwWU7o;License: Standard Youtube License