
Videos
One portion of the research described in a paper by Yean-Jye Lu5 involved an evaluation of maneuver times for vehicles of various sizes that were involved in making a left turn at an intersection with a separate left-turn lane but without a separate left-turn phase on the traffic light governing the intersection (an “unprotected” left-turn maneuver). The maneuver time was measured from the instant that a vehicle entered the opposing lanes of traffic until it completely cleared the intersection. Four-cylinder automobiles were classified as “small cars” and sixor eight-cylinder automobiles as “large cars.” Trucks and buses were combined to form a third category identified as “truck or bus.” Other motorized vehicles (motorcycles, etc.) were ignored in the study. A summary of the data, giving maneuver times (in seconds) for vehicles that attempted the left-turn maneuver from a standing stop, appears in the accompanying table.
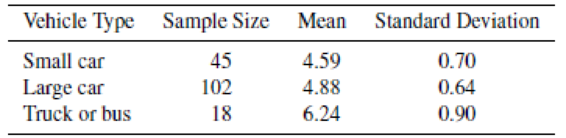
a Is there sufficient evidence to claim that the mean maneuver times differ for the three vehicle types? Give bounds for the attained significance level.
b Indicate the appropriate conclusion for an α = .05 level test.
Want to see the full answer?
Check out a sample textbook solution
Chapter 13 Solutions
Mathematical Statistics with Applications


- Should advertisers worry about people with digital video recorders (DVRs) fast-forwarding through their TV commercials? Recent studies by MillwardBrown and Innerscope Research indicate that when people are fast-forwarding through commercials they are actually still quite engaged and paying attention to the screen to see when the commercials end and when the show they were watching starts again. If a commercial goes by that the viewer has seen before, the impact of the commercial may be equivalent to viewing the commercial at normal speed. One study of DVR viewing behavior is described in the article "Engaging at Any Speed? Commercials Put to the Test."† For each person in a sample of adults, physical responses (such as respiratory rate and heart rate) were recorded while watching commercials at normal speed and while watching commercials at fast-forward speed. These responses were used to calculate an engagement score. Engagement scores ranged from 0 to 100 (higher values indicate…arrow_forwardShria tested the hypothesis that, on average, older rats from the cotton rat species have faster average maze completion rates than younger rats from the cotton rat species. On January 12, 2020, she documented the maze completion rates in seconds of a randomly selected sample of 33 younger cotton rats and of a randomly selected sample of 32 older cotton rats. She concluded that, on average, older rats from the cotton rat species do not have faster average maze completion rates than younger rats from the cotton rat species. Refer to Exhibit 1. What is the control variable?arrow_forwardAnother researcher also decides to conduct a study to observe the association between smoking cessation among long-term smokers and obesity since it has been previously well documented in the literature that smokers tend to gain weight when they stop smoking. The researcher notes that among the individuals who gain weight, many of them have developed heart problems or other medical problems that typically prevent them from exercising as much as their counterparts. In this case the researcher notes that individuals who have developed the heart problems or other medical problems causing them to gain weight also came from family with a high prevalence of risk-taking behaviors so they consume unhealthy diets and are less likely to exercise in general than their counterparts. This is an example of which of the following? Multilpe Choice Confounding Effect modification Recall bias Socially desirable response biasarrow_forward
- Assuming Get Food Now achieved 12,000 interactions, how many of these would have resulted in customer being less than satisfied with their first interaction?arrow_forwardA panel of dentists is interested in testing two different toothpaste brands (A and B) to see if there is a relationship between the brand and whether or not the patient has a cavity at their next appointment. A representative sample of 60 patients is recruited to take part in this study. At their first appointment of the year, each subject is assigned to brush their teeth with one of the two brands for the next six months. At their follow-up appointment six months later, they were checked for cavities. ******In the sample, 6 of the 30 patients assigned to Brand A were found to have a cavity. The fraction 6/30 should be denoted by which of the following? μ x̄ p p̂ n s σ χ²arrow_forwardSince muscle tension in the head region has been associated with tension headaches, a researcher reasoned that if the muscle tension could be changed, perhaps the headaches would also be changed. The researcher designed an experiment in which nine subjects with tension headaches participated. The subjects kept daily logs of the number of headaches they experienced during a 2-week baseline period. Then the researcher trained them to change their muscle tension in the head region, using a biofeedback device. For this experiment, the biofeedback device was connected to a muscle in the forehead region. The device indicated the subject's amount of tension in the muscle to which it was attached and helped them achieve low tension levels. After 6 weeks of training, during which the subjects became successful at maintaining low muscle tension, they again kept a 2-week log of the number of headaches experienced. The following are the number of headaches recorded during each 2-week period.…arrow_forward
- Research done at the Harvard School of Public Health showed that regular soda drinkers may have a tendency toward the weak and brittle bones associated with osteoporosis. They surveyed 2,622 women who were active athletes in college and classified them as to whether they regularly drank soft drinks or rarely drank soft drinks. The proportion of women in each group who suffered from bone fractures was determined. The findings: those who regularly drank soft drinks were twice as likely to suffer from bone fractures as those who rarely drank soft drinks. Source: Health and Fitness News Service, August 21, 1996. a. Was this an observational study or an experiment? Explain.b. What is the population under study?c. What was the explanatory variable?d. What was the response variable?e. What are some possible confounding variables in this study?arrow_forwardIn a winter with a flu epidemic, a well-known pharmaceutical company studied 2,000 babies to determine if the company's new drug was effective after two days. Among 120 babies who had the flu and were given the drug, 29 were cured within two days. Among 280 babies who had the flu but were not given the drug, 56 were cured within two days. Is there any significant indication to support the company's claim of the drug's effectiveness? Note:The exercise in the image is the original, it is in Spanish, but it is easy to understand.arrow_forwardA neuroscientist hypothesizes that she found the region in the rat brain responsible for the motion of the right paw. She trains 20 right-handed rats in a specific task to push a lever to to receive a tasty pellet of food. After the all the rats learn the behavior, she randomly selects 10 of them a does a surgery to place an implant on the brains of rats through which a lazer can deactivate the said region in the brain. After the rats heal, she runs all the rats through the same task. While 10 of them went through the experiment unbothered, the other 10 who had the implant were stimulated by a lazer through their implants to disrupt the functioning of the hypothesized critical region. The neuroscientist collected the amount of rewards(number of food pellets received)the rats in both groups were able to collect:Xsurgery: 2, 4, 3, 1, 5, 3, 4, 1, 3, 4Xcontrol: 5, 6, 4, 6, 8, 9, 2, 5, 6, 3 d. Calculate 95% confidence intervals for the estimate of the difference.arrow_forward
- A neuroscientist hypothesizes that she found the region in the rat brain responsible for the motion of the right paw. She trains 20 right-handed rats in a specific task to push a lever to to receive a tasty pellet of food. After the all the rats learn the behavior, she randomly selects 10 of them a does a surgery to place an implant on the brains of rats through which a lazer can deactivate the said region in the brain. After the rats heal, she runs all the rats through the same task. While 10 of them went through the experiment unbothered, the other 10 who had the implant were stimulated by a lazer through their implants to disrupt the functioning of the hypothesized critical region. The neuroscientist collected the amount of rewards(number of food pellets received)the rats in both groups were able to collect:Xsurgery: 2, 4, 3, 1, 5, 3, 4, 1, 3, 4Xcontrol: 5, 6, 4, 6, 8, 9, 2, 5, 6, 3 c. Conduct the test. Make a decision about the null hypothesis, interpret your results and…arrow_forwardA neuroscientist hypothesizes that she found the region in the rat brain responsible for the motion of the right paw. She trains 20 right-handed rats in a specific task to push a lever to to receive a tasty pellet of food. After the all the rats learn the behavior, she randomly selects 10 of them a does a surgery to place an implant on the brains of rats through which a lazer can deactivate the said region in the brain. After the rats heal, she runs all the rats through the same task. While 10 of them went through the experiment unbothered, the other 10 who had the implant were stimulated by a lazer through their implants to disrupt the functioning of the hypothesized critical region. The neuroscientist collected the amount of rewards(number of food pellets received)the rats in both groups were able to collect:Xsurgery: 2, 4, 3, 1, 5, 3, 4, 1, 3, 4Xcontrol: 5, 6, 4, 6, 8, 9, 2, 5, 6, 3 A. Name the appropriate statistical procedure to apply. B. Identify the predictor and predicted…arrow_forwardIn terms of the model parameters, state the null hypothesis that, after controlling for sales and roe, ros has no effect on CEO salary. State the alternative that better stock market performance increases a CEO’s salary.arrow_forward
 Linear Algebra: A Modern IntroductionAlgebraISBN:9781285463247Author:David PoolePublisher:Cengage Learning