
Mathematical Statistics with Applications
7th Edition
ISBN: 9780495110811
Author: Dennis Wackerly, William Mendenhall, Richard L. Scheaffer
Publisher: Cengage Learning
expand_more
expand_more
format_list_bulleted
Videos
Textbook Question
Chapter 13.9, Problem 43E
Refer to Exercise 13.42. Why was a randomized block design used to compare the chemicals?
13.42 The accompanying table presents data on yields relating to resistance to stain for three materials (M1, M2, and M3) treated with four chemicals in a randomized block design. (A low value indicates good stain resistance.)
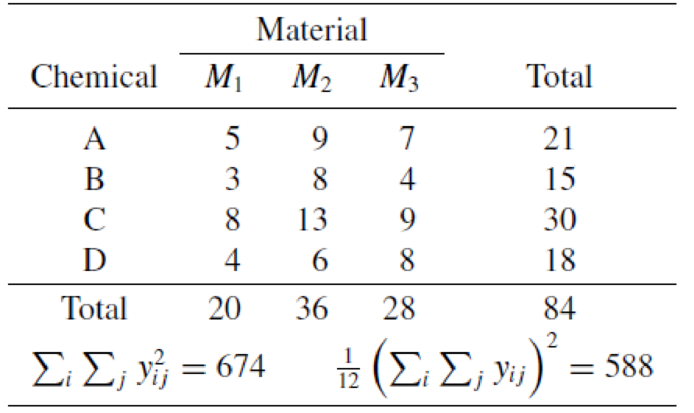
a Is there evidence of differences in mean resistance among the four chemicals? Give bounds for the p-value.
b What would you conclude at the α = .05 level of significance?
Expert Solution & Answer
Want to see the full answer?
Check out a sample textbook solution
Students have asked these similar questions
The NAEP considers that a national average of 283 is an acceptable performance. Using α = .05, run a two-tail t-test for one sample to test Ho: µ=283 for the 2019 scores. Report the t-obt, df, and p-values.
Would you reject the null hypothesis that the 2019 scores come from a population with average 283? If this is the case, does it come from a population from larger or smaller average?
A nationwide study of undergraduate students reported that the mean number of drinks consumed per week during the spring semester is 7.96. The mean number of drinks consumed per week at USC is 7.64 (s.d.=2.55, N=412
Health services is concerned that USC students are consuming significantly more alcohol per week than the national average. Using an alpha level of .05, Is there sufficient evidence to be concerned? Be sure to select the correct critical value for the alternative hypothesis, and then use this evidence to make your conclusion
The median pH level of the rain in a certain county, was 4.90. A biologist obtains a random sample of 19 rain dates and obtains the following data. Test the hypothesis that the median pH level has decreased from 4.90 at the alpha= 0.05 level of significance.
Chapter 13 Solutions
Mathematical Statistics with Applications
Ch. 13.2 - The reaction times for two different stimuli in a...Ch. 13.2 - Prob. 2ECh. 13.4 - State the assumptions underlying the ANOVA of a...Ch. 13.4 - Prob. 4ECh. 13.4 - Prob. 5ECh. 13.4 - Suppose that independent samples of sizes n1, n2,,...Ch. 13.4 - Four chemical plants, producing the same products...Ch. 13.4 - Prob. 8ECh. 13.4 - Prob. 9ECh. 13.4 - A clinical psychologist wished to compare three...
Ch. 13.4 - It is believed that women in the postmenopausal...Ch. 13.4 - If vegetables intended for human consumption...Ch. 13.4 - One portion of the research described in a paper...Ch. 13.4 - The Florida Game and Fish Commission desires to...Ch. 13.4 - Prob. 15ECh. 13.4 - An experiment was conducted to examine the effect...Ch. 13.5 - Prob. 17ECh. 13.5 - Refer to Exercise 13.17 and consider YiYi for i ...Ch. 13.5 - Refer to the statistical model for the one-way...Ch. 13.7 - Refer to Examples 13.2 and 13.3. a Use the portion...Ch. 13.7 - Refer to Examples 13.2 and 13.4. a Use the portion...Ch. 13.7 - a Based on your answers to Exercises 13.20 and...Ch. 13.7 - Refer to Exercise 13.7. a Construct a 95%...Ch. 13.7 - Prob. 24ECh. 13.7 - Prob. 25ECh. 13.7 - Prob. 26ECh. 13.7 - Prob. 27ECh. 13.7 - Prob. 28ECh. 13.7 - Prob. 29ECh. 13.7 - Prob. 30ECh. 13.7 - Prob. 31ECh. 13.7 - Prob. 32ECh. 13.7 - Prob. 33ECh. 13.7 - Prob. 34ECh. 13.7 - Prob. 35ECh. 13.8 - Prob. 36ECh. 13.8 - Prob. 37ECh. 13.8 - Prob. 38ECh. 13.8 - Prob. 39ECh. 13.8 - Prob. 40ECh. 13.9 - Prob. 41ECh. 13.9 - The accompanying table presents data on yields...Ch. 13.9 - Refer to Exercise 13.42. Why was a randomized...Ch. 13.9 - Prob. 44ECh. 13.9 - Prob. 45ECh. 13.9 - Prob. 46ECh. 13.9 - Prob. 47ECh. 13.9 - Prob. 48ECh. 13.9 - Prob. 49ECh. 13.9 - Prob. 50ECh. 13.9 - Prob. 51ECh. 13.10 - Prob. 52ECh. 13.10 - Prob. 53ECh. 13.10 - Prob. 54ECh. 13.10 - Refer to Exercise 13.46. Construct a 95%...Ch. 13.10 - Prob. 56ECh. 13.10 - Prob. 57ECh. 13.11 - Prob. 58ECh. 13.11 - Prob. 59ECh. 13.11 - Prob. 60ECh. 13.11 - Prob. 61ECh. 13.11 - Prob. 62ECh. 13.12 - Prob. 63ECh. 13.12 - Prob. 64ECh. 13.12 - Prob. 65ECh. 13.12 - Prob. 66ECh. 13.12 - Prob. 67ECh. 13.12 - Prob. 68ECh. 13.13 - Prob. 69ECh. 13.13 - Prob. 70ECh. 13.13 - Refer to Exercise 13.42. Answer part (a) by...Ch. 13.13 - Refer to Exercise 13.45. Answer part (b) by...Ch. 13 - Prob. 73SECh. 13 - Prob. 74SECh. 13 - Prob. 75SECh. 13 - Prob. 77SECh. 13 - A study was initiated to investigate the effect of...Ch. 13 - Prob. 79SECh. 13 - A dealer has in stock three cars (models A, B, and...Ch. 13 - In the hope of attracting more riders, a city...Ch. 13 - Prob. 84SECh. 13 - Prob. 85SECh. 13 - Prob. 86SECh. 13 - Prob. 87SECh. 13 - Prob. 88SECh. 13 - Prob. 89SECh. 13 - Prob. 90SECh. 13 - Prob. 92SECh. 13 - Prob. 94SE
Knowledge Booster


Learn more about
Need a deep-dive on the concept behind this application? Look no further. Learn more about this topic, statistics and related others by exploring similar questions and additional content below.Similar questions
- The appearance of leaf pigment glands in the seedling stage of cotton plants is genetically controlled. According to one theory of the control mechanism, the population ratio of glandular to glandless plants resulting from a certain cross should be 11.5, according to another it should be 13:3. In one experiment, the cross produced 89 glandular and 36 glandless plants. Use goodness-of-fit tests (at alpha= 0.10) to determine whether the data is consistent with a) the 11:5 theory, ar b) the 13:3 theory.arrow_forwardA researcher conducts an independent-measures study comparing two treatments and reports the t statistic as t(25)=2.071 . How many individuals participated in the entire study? Using a two-tailed test with αα=.05 , is there a significant difference between the two treatments? Compute r2 to measure the percentage of variance accounted for by the treatment effect.arrow_forwardThe average UQ student reports dedicating 8.5 hours per week to each 2-unit course. What is the approximate t obtained value for a group of 16 psychology students who study for a mean of 9.5 hours per week for each 2-unit course, where the estimated population variance is 3.68. Would this sample be considered significantly different from the population, applying an alpha level of 0.05? t = 0.48; the sample would be considered statistically significant t = 0.48; the sample would NOT be considered statistically significant t = 2.08; the sample would NOT be considered statistically significant t = 2.08; the sample would be considered statistically significantarrow_forward
- A snack food manufacturer estimates that the variance of the number of grams of carbohydrates in servings of its tortilla chips is 1.141.14. A dietician is asked to test this claim and finds that a random sample of 2424 servings has a variance of 0.950.95. At alpha equals 0.10α=0.10, is there enough evidence to reject the manufacturer's claim? Assume the population is normally distributed.arrow_forwardA researcher uncovers that there is a significant interaction between the factor of marital status (i.e., married or non-married) and participant sex (i.e., male or female) regarding well-being among a sample with n = 6 participants in each condition. What would the critical value for the F-ratio be for a hypothesis test examining the difference in well-being between married men and women using an alpha level of α = .01? a. F = 3.49 b. F = 8.10 c. F = 5.85 d. F = 4.35arrow_forward3) A firm in Lebanon has developed a chemical solution that can be added to car gasolinewhich they believe will increase the miles per gallon that cars will get. The owners areinterested in estimating the difference between mean mpg for cars using the chemicalsolution versus those that are not using the solution. The following data represent the mpgfor independent random samples of cars from each population.with Solution without Solution______________________________n1 = 36 n2 = 42 x1 = 25.45 x2 = 24.1 _______________________________Assume that the populations are normally distributed and the population standarddeviations are known to be σ1 = 3.95 (with solution) and σ2 = 3.09 (without solution).Given this data, can the owners believe that there is a difference between mean mpg forcars using the chemical solution versus those that are not using the solution? Test using analpha level equal to 0.05.4) Given the following null and alternative hypothesis:H0: σ 2 ≤ 52HA : σ 2 > 52and the…arrow_forward
- In a survey of 460 drivers from the South, 397 wear a seat belt. In a survey of 340 drivers from the Northeast, 281 wear a seat belt. At alpha equals 0.06 , can you support the claim that the proportion of drivers who wear seat belts is greater in the South than in the Northeast? Assume the random samples are independent. Complete parts (a) through (e).arrow_forwardJohn rejected a null hypothesis in a right-tailed test for a mean at alpha = 0.025 because the critical T value was 2.000 and his calculated T value was 2.345. We can be sure that: a.) John did not commit type 1 error B.) John committed neither type 1 nor type 11 error c.) none of the presented answers is correct because none can definitely be concluded d.) John did not commit type 11 errorarrow_forwardAn electrical engineer wishes to determine if, among two specific municipal buildings in town, Building “North” and Building “South”, whether the tensile strength of pipes (in psi) is not the same in each of these two buildings. A sample of pipes was chosen at random from both Building “North” and Building “South”, respectively. Using α = 0.05, which of the following statistical test, or parameter, would be best for determining whether tensile strength of pipes (in psi) is not the same in each of these two buildings? (Assume all statistical assumptions met.) a) Binomial Distribution b) Population Difference in Means (i.e., Unpaired Data) c) The Chi-Squared Test of Independence d) Population Mean Difference (i.e., Paired Data)arrow_forward
- A manufacturer of flashlight batteries claims that the average life of her batteries is larger than 400 hours. Peter, as a quality assurance officer in the manufacturing company, took a random sample of 13 batteries from a day’s production and used them continuously until they failed to work. The lifetime (hours) until failure was:342 426 317 545 264 451 1049 631 512 266 492 562 298 (a) At the 0.05 level of significance, is there evidence that the manufacturer’s claim is correct? (b) What is the p-value?arrow_forwardThe researchers reported:" A 2x2 ANOVA revealed, first of all, a main effect for depletion, indicating that depleted individuals generated less ideas (M = 9.40, SD = 5.64) than non-depleted individuals (M = 12.44, SD = 7.34), F (1, 108) = 6.03, p = .016, n2 = .05. This effect was qualified by the expected interaction with [perseverance], F (1,108) = 4.52, p = .036, n2 = .05". What size are the effects for the main effect of depletion and for the interaction between depletion and perseverance, according to Cohen's conventions? a. These are small- to -medium effects b. These are non existent effects c. These are large effects d. We are unable to tell from from the n2 / r2 statisticsarrow_forwardDr. Romanoff reported the following in a journal: “F (5, 106) = 10.09, p = .04.” Should Dr. Romanoff state that there are significant differences among the variable means at a .05 alpha level?arrow_forward
arrow_back_ios
SEE MORE QUESTIONS
arrow_forward_ios
Recommended textbooks for you
 Glencoe Algebra 1, Student Edition, 9780079039897...AlgebraISBN:9780079039897Author:CarterPublisher:McGraw Hill
Glencoe Algebra 1, Student Edition, 9780079039897...
Algebra
ISBN:9780079039897
Author:Carter
Publisher:McGraw Hill
Hypothesis Testing using Confidence Interval Approach; Author: BUM2413 Applied Statistics UMP;https://www.youtube.com/watch?v=Hq1l3e9pLyY;License: Standard YouTube License, CC-BY
Hypothesis Testing - Difference of Two Means - Student's -Distribution & Normal Distribution; Author: The Organic Chemistry Tutor;https://www.youtube.com/watch?v=UcZwyzwWU7o;License: Standard Youtube License