
Concept explainers
Videos
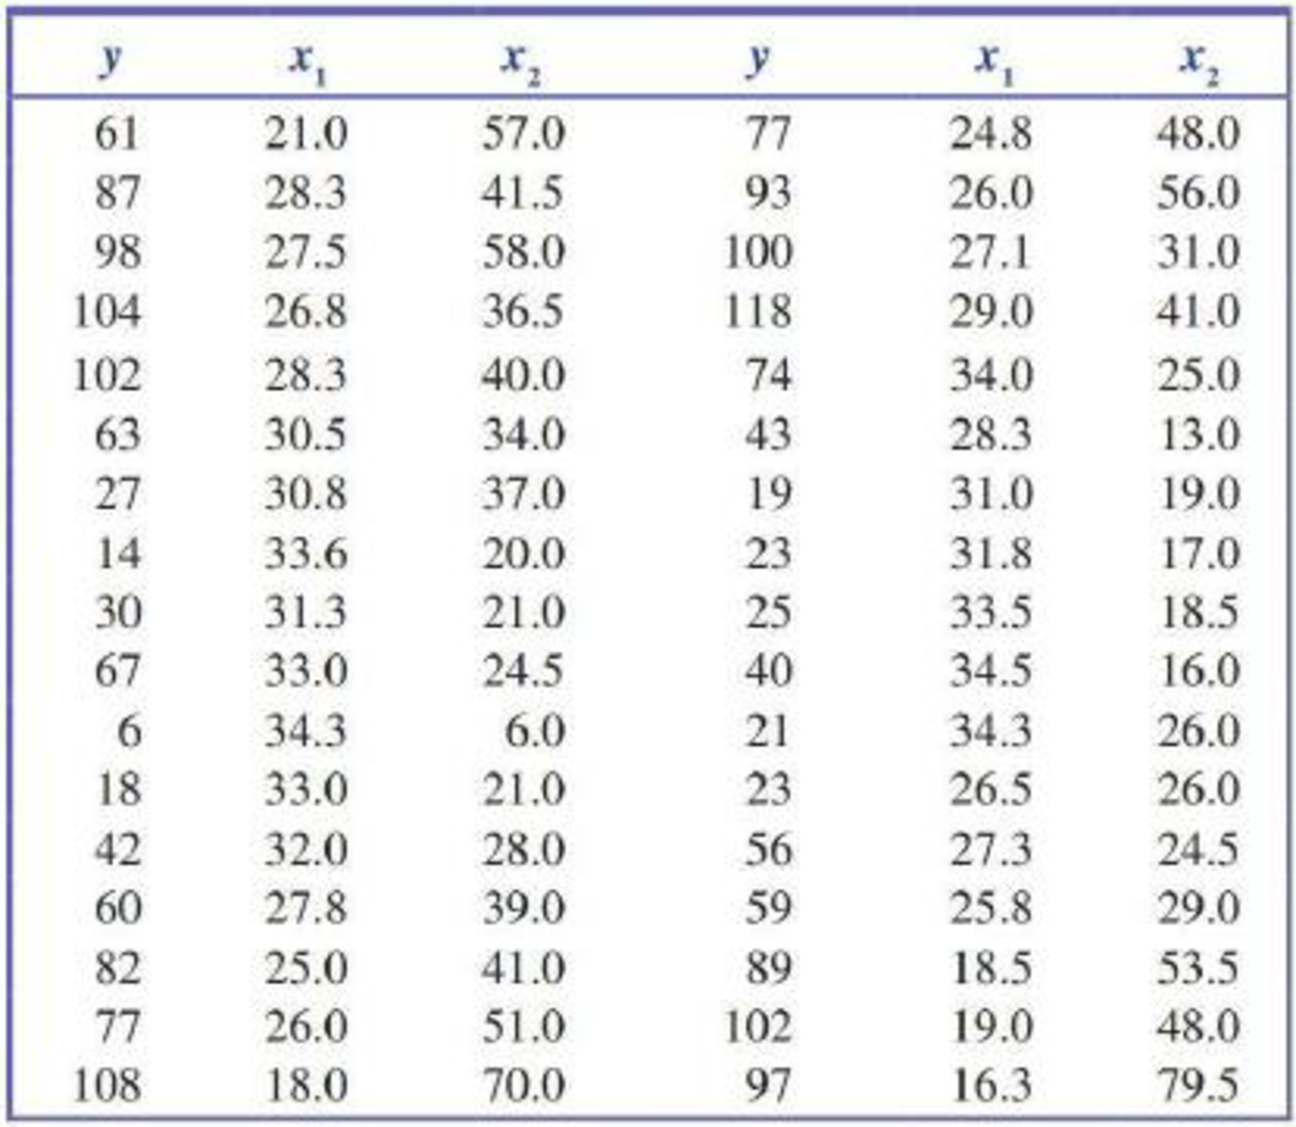
This exercise requires the use of a statistical software package. The cotton aphid poses a threat to cotton crops. The accompanying data on
appeared in the article “Estimation of the Economic Threshold of Infestation for Cotton Aphid” (Mesopotamia Journal of Agriculture [1982]: 71–75). Use the data to find the estimated regression equation and assess the utility of the multiple regression model
Want to see the full answer?
Check out a sample textbook solution
Chapter 14 Solutions
Introduction to Statistics and Data Analysis


- Assume we have data demonstrating a strong linear link between the amount of fertilizer applied to certain plants and their yield. Which is the independent variable in this research question?arrow_forwardThe cotton aphid poses a threat to cotton crops in Iraq. The accompanying data on y = infestation rate (aphids/100 leaves) X1 = mean temperature (°C) x, = mean relative humidity appeared in the article “Estimation of the Economic Threshold of Infestation for Cotton Aphid" (Mesopotamia Journal of Agriculture [1982]: 71–75). Use the data to find the estimated regression equation and assess the utility of the multiple regression model y = a + Bjx1 + Bx2 + e y X1 X2 y X1 X2 61 21.0 57.0 77 24.8 48.0 87 28.3 41.5 93 26.0 56.0 98 27.5 58.0 100 27.1 31.0 104 26.8 36.5 118 29.0 41.0 102 28.3 40.0 74 34.0 25.0 63 30.5 34.0 43 28.3 13.0 27 30.8 37.0 19 31.0 19.0 14 33.6 20.0 23 31.8 17.0 30 31.3 21.0 25 33.5 18.5 67 33.0 24.5 40 34.5 16.0 34.3 6.0 21 34.3 26.0 18 33.0 21.0 23 26.5 26.0 42 32.0 28.0 56 27.3 24.5 60 27.8 39.0 59 25.8 29.0 82 25.0 41.0 89 18.5 53.5 77 26.0 51.0 102 19.0 48.0 108 18.0 70.0 97 16.3 79.5 Given: significance level = 0.05 Required: 1. Regression Equation 2. F and…arrow_forwardWe have data on Lung Capacity of persons and we wish to build a multiple linear regression model that predicts Lung Capacity based on the predictors Age and Smoking Status. Age is a numeric variable whereas Smoke is a categorical variable (0 if non-smoker, 1 if smoker). Here is the partial result from STATISTICA. b* Std.Err. of b* Std.Err. N=725 of b Intercept Age Smoke 0.835543 -0.075120 1.085725 0.555396 0.182989 0.014378 0.021631 0.021631 -0.648588 0.186761 Which of the following statements is absolutely false? A. The expected lung capacity of a smoker is expected to be 0.648588 lower than that of a non-smoker. B. The predictor variables Age and Smoker both contribute significantly to the model. C. For every one year that a person gets older, the lung capacity is expected to increase by 0.555396 units, holding smoker status constant. D. For every one unit increase in smoker status, lung capacity is expected to decrease by 0.648588 units, holding age constant.arrow_forward
- 4b) The data shows a systolic and a diastolic blood pressure of certain patients. Find the linear regression equation, using the first variable x (systolic) as the independent variable. Find the best predicted diastolic blood pressure for a patient with a systolic blood pressure (y) reading of 140. What is the correlation coefficient, r? Using a significance level of a = 0.05, is there a significant linear relationship between systolic and diastolic blood pressure? Blood Pressure: Systolic Diastolic 112 125 115 136 143 116 123 124 elimii 70 89 65 90 97 64 SUTT nisinoo aqdM 21.SS bns aqdM 78 ahoqnis erit te zbesqz steb ils to 69 bns ago 20.EI to adimil srit terit sonabilnos 2 nistnoo aqdM 21.SS bnc agdM sgsavs arit ferli mislo a hoqnis orti roqque lovedni sonsbilnos 3028 wolsd insmsisiz tomo artezorio SeqdM 2.55 al 2.SS to sulavadi znistmoodi ezusaed mish ads toqque ton zaob 2.55 to sulsy sdt anistroo ti sausosd mislo ert hoqquz 200b to sulav orit nisinoo ton zoob 11 saussed misbb adi…arrow_forwardThe quality of the orange juice produced by a certain manufacturer is constantly monitored. Data collected on the sweetness index of an orange juice sample and amount of water-soluble pectin for 24 production runs at a juice manufacturing plant are shown in the accompanying table. Suppose a manufacturer wants to use simple linear regression to predict the sweetness (y) from the amount of pectin (x). Find and interpret the coefficient of determination, r2, and the coefficient of correlation, r. Find and interpret the coefficient of determination, r2. Select the correct choice below and fill in the answer box within your choice. (Round to three decimal places as needed.) A. The coefficient of determination, r2, is enter your response here. Sample variations in the amount of water-soluble pectin explain 100r2% of the sample variation in the sweetness index using the least squares line. B. The coefficient of determination, r2, is enter your…arrow_forwardCalculate the equation of the regression line and calculate the correlation coefficientarrow_forward
- Find the fitted regression line for these data.arrow_forwardQ1) Interpret the following regression line y = 10.50 – 0.18xarrow_forwardSuppose a study wants to predict the market price of a certain species of turtle (Y) based on the following independent variables indicated in the table. Based from the table, what is the equation of the multiple linear regression? (Round off up to two decimal places. Market Price = 0.07 - 0.40*weight + 1.51*length + 1.41*width + 0.80*age Market Price = - 0.40*weight + 1.51*length + 1.41*width + 0.80*age Market Price = 0.07 + 0.40*weight + 1.51*length + 1.41*width + 0.80*age Market Price = 0.07 - 0.40 + weight + 1.51 + length + 1.41 + width + 0.80 + agearrow_forward
- The least-squares regression equation is y=620.6x+16,624 where y is the median income and x is the percentage of 25 years and older with at least a bachelor's degree in the region. The scatter diagram indicates a linear relation between the two variables with a correlation coefficient of 0.7004. Predict the median income of a region in which 30% of adults 25 years and older have at least a bachelor's degree.arrow_forwardFind the equation of the regression line for the data based on time spend forstudying and current CGPAarrow_forwardThe data from the table below gives a regression that is a) reliable. b) unreliable. c) unable to determine the reliability.arrow_forward
 MATLAB: An Introduction with ApplicationsStatisticsISBN:9781119256830Author:Amos GilatPublisher:John Wiley & Sons Inc
 Probability and Statistics for Engineering and th...StatisticsISBN:9781305251809Author:Jay L. DevorePublisher:Cengage Learning
 Statistics for The Behavioral Sciences (MindTap C...StatisticsISBN:9781305504912Author:Frederick J Gravetter, Larry B. WallnauPublisher:Cengage Learning
 Elementary Statistics: Picturing the World (7th E...StatisticsISBN:9780134683416Author:Ron Larson, Betsy FarberPublisher:PEARSON
 The Basic Practice of StatisticsStatisticsISBN:9781319042578Author:David S. Moore, William I. Notz, Michael A. FlignerPublisher:W. H. Freeman
 Introduction to the Practice of StatisticsStatisticsISBN:9781319013387Author:David S. Moore, George P. McCabe, Bruce A. CraigPublisher:W. H. Freeman