
Principles of Instrumental Analysis
7th Edition
ISBN: 9781305577213
Author: Douglas A. Skoog, F. James Holler, Stanley R. Crouch
Publisher: Cengage Learning
expand_more
expand_more
format_list_bulleted
Concept explainers
Videos
Textbook Question
Chapter 15, Problem 15.15QAP
The following lifetimes were measured for the chloride quenching of quinine sulfate given in Example 15-1.The fluorescence intensities are given in the example.
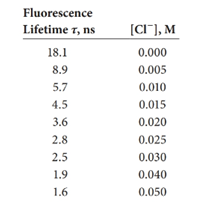
(a) Plot fluorescence intensity versus [Cl-].
(b) Plot the ratio of intensity to lifetime, F-
(c) Develop a normalization factor to correct the measured fluorescence intensity to that of the solution without quencher.
(d) Plot on the same graph Fversus [Cl-] and Fcorr versus (CI-].
Expert Solution & Answer
Want to see the full answer?
Check out a sample textbook solution
Students have asked these similar questions
Quinine in a 1.553-g antimalarial tablet was dissolved in sufficient 0.10 M HCl to give 250 mL of solution.A 10.00-mL aliquot was then diluted to 50.00 mL with the acid. The fluorescence intensity for the dilutedsample at 347.5 nm provided a reading of 196 on an arbitrary scale. A standard 100-ppm quinine solutionregistered 125 when measured under conditions identical to those for the diluted sample. Calculate the massin milligrams of quinine in the tablet.
(d) In water, the fluorescence quantum yield and observed fluorescence lifetime of
tryptophan are Ps = 0.20 and to = 2.6 ns, respectively. Estimate fluorescence rate (k;) of
the tryptophan.
Trace amounts of rare clements are found within groundwater
and are of interest to goochemists. Earopium and terbium are
30 -
lanthanide-scries clements that can be measured from the
intensity of their fluorescence emittcd when a solution is
illuminated with ultraviolet radiation. Certain organic
25 -
compounds that bind Eu(III) and Tb(IIl) enhance the
cmission, and substances found in natural waters can decrease
20-
the cmission. For that reason it is necessary to use standard
Eu (II)
additions to the sample to correct for such interference. The
graph shows the result of such an cxperiment in which the
15-
concentration of Eu(III) and Tb(III) was mcasured in a
sample of groundwatler. The x-intercept of the Eu(III) plot is
10-
-23.1 ml. and the x-intercept of the Th(III) plot is -9.91 ml.
In cach case, 10.00 ml. of the sample solution and 15.00 ml.
5-
Tb (III)
of an organic additive were added to a scries of live 50 ml.
volumctric flasks. The standard Eu(lI) or Th(III) solution (0,…
Chapter 15 Solutions
Principles of Instrumental Analysis
Knowledge Booster


Learn more about
Need a deep-dive on the concept behind this application? Look no further. Learn more about this topic, chemistry and related others by exploring similar questions and additional content below.Similar questions
- Exactly 5.00 mL aliquots of a solution containing analyte X were transferred into 50.00-mL volumetric flasks and the pH of the solution is adjusted to 9.0. The following volumes of a standard solution containing 2.00 µg/mL of X were then added into each flask and the mixture was diluted to volume: 0.000, 0.500, 1.00, 1.50 and 2.00 mL. The fluorescence of each of these solutions was measured with a fluorometer, and the following values were obtained: 3.26, 4.80, 6.42, 8.02 and 9.56, respectively. ii. Using relevant functions in Excel, derive a least-squares equation for the data, and use the parameters of this equation to find the concentration of the phenobarbital in the unknown solution.arrow_forward6. Blue Blue dye stock solution 0.293 M Absorbance at 630 nm 0.00265 Calibration curve y = 0.0833x A solution is prepared by diluting 2.79 mL of the blue dye stock solution to 25.00 mL. The measured absorbance for the prepared solution is listed in the data table. (a) What is the theoretical molar concentration? [Blue]theoretical x 10 |M (b) What is the experimental molar concentration? [Blue]experimental x 10 M (c) What is the percent error? Percent error (blue) = %arrow_forwardFor a molecule, the phosphorescence lifetime without quenching is 1.0 s while with a quencher population of 10-2 M the phosphorescence lifetime is 0.10 s. Calculate the rate constant for phosphorescence assuming that kisc >> (kF + kec + kic). Calculate the rate constant for external conversion of the triplet state (kec’), the quenching rate constant for the triplet state (kq’), and the Stern-Volmer quenching constant. Assume that intersystem crossing from T1 to So is negligible.arrow_forward
- Chemistry Calculate the concentration of an anthracene solution which produced a fluorescence intensity (I) of 835 when the irradiance of the beam incident to the sample (Po) was 1.580 x 10' and the length of the medium (b) was 0.891 cm. Anthracene has a molar extinction coefficient (e) of 9.5 x 10 M-¹ cm. The proportionality constant k' for anthracene is 0.30. CO Marrow_forwardYou have measured the blank for a determination of arsenic in food samples by hydride-generation atomic fluorescence spectrometry. The blank values are: 0.23 ppb, 0.14 ppb, 0.16 ppb, 0.28 ppb, 0.18 ppb, 0.09 ppb, 0.10 ppb, 0.20 ppb, 0.15 ppb, 0.21 ppb As. What is the LOD?arrow_forwardDuring a spectroscopic evaluation of the several solutions of C6H5CH=CHCCl₂ in ethanol using a 1.0 cm spectrophotometric cell, different values of absorbance (A) were obtained, which are given in the following table: 105 x conc. mol dm-3 A time min A 0.446 0.080 0 0.560 C When the reaction of C6H5CH=CHCCl₂ with C₂H5O in an ethanolic medium is followed spectroscopically at a convenient wavelength (2), the following results are found: 0.812 0.145 40 0.283 1.335 1.711 0.240 0.305 80 0.217 120 2.105 0.378 0.168 140 0.149 The values of ε at λ and the rate constant for that reaction are: a. ε = 1.79x10⁻⁶ dm³ mol-¹ cm-¹ and k = 0.034 dm³ mol-¹ min-¹ b. ε = 1.79×10⁴ dm³ mol-¹ cm-¹ and k = 0.034 dm³ mol-¹ min-¹ c. ε = 1.79x10⁻⁶ dm³ mol-¹ cm-1 and k = 8.9x10-³ dm³ mol-¹ min-¹ d. ε = 1.79×10⁴ dm³ mol-¹ cm-¹ and k = 8.9x10-³ dm³ mol-¹ min¯¹arrow_forward
- The observed fluorescence lifetime in the absenceof a quencher is 1.4 ns. In the presence of a quencher thefluorescence lifetime is 0.8 ns. Calculate the quenching efficiency. which is the ratio of the fluorescence quantum yieldsin the presence and absence of the quencher. ¢,/¢,_0arrow_forward(a) You measure the percent transmittance of a solution containing chromophore X at 400nm in a 1-cm path length cuvette and find it to be 50%. What is the absorbance of this solution? (b) What is the molar absorptivity of chromophore X if the concentration of X in the solution measured in question (a) is 0.5mM? (c) What is the concentration range of chromophore X that can be assayed if, when using a sample cell of path length 1, you are required to keep the aborbance between 0.2 and 0.8?arrow_forwardFor a tungsten carbene (catalyst) binding to THF (ligand) at 25 oC in per-deuterotoluene solvent, the chemical shift of the unbound catalyst alpha hydrogen was determined to be 794.6 Hz and the peak for the fully bound catalyst alpha hydrogen was observed at 842.4 Hz. Furthermore, the binding constant (or formation constant) Kf was found to be 15.40 M-1. Given the following initial concentrations of catalyst and ligand, calculate the percent THF bound you would expect to see at 25 oC. Record your answer to the nearest tenths of a percent, as a number with no units (Ex. 3.4% ----> enter "3.4") Co = 1.000 M Lo = 0.1000 Marrow_forward
- In the HQS-Mg fluorescence part of Lab 6, a calibration curve is made of fluorescence intensity vs. MgCl2 concentration (M). The standard solutions for the calibration curve were made by mixing a small amount of 0.01 M MgCl2 with some HQS solution. Calculate the concentration of MgCl2 (M) in each of the following standards. Report your concentrations to 3 sig figs. Fluorescence Volume of 0.01 M Volume of 1 mM Concentration of MgCl2 (M) Intensity MgCl2 (mL) HQS (mL) 0.031250902 0.8 100 0.049490754 0.8 50 0.059803507 2 100 0.085834029 3.6 100 Hint: The total volume of each solution is volume of 0.01 M MgCl2 + volume of 1 mM HQS.arrow_forwardFe2+ is used as a catalyst for the oxidation of luminal by H,02. The resulting chemiluminescence increases linearly with Fe2* concentration. Exactly 1.0 mL of water was added to a 5.0-mL sample of an unknown Fe2* solution, followed by 2.0 mL of H20, and 1.0 mL of luminol. The chemiluminescence intensity was found to be 16.1. When 1.0 mL of 4.75 x 10 SM Fe2+ solution was added to another 5.0-mL of the unknown Fe2+ solution, followed by 2.0 mL of H,0, and 1.0 mL of luminol, the chemiluminescence intensity was 39.6. Calculate the concentration of iron ions in the sample. O 6.5 x 10⁶ M 9.0 x 10 5 M 1.4 x 10 5 M 1.3 x 10⁴ M 1.6 x 10⁴ Marrow_forwardAtomic Spectroscopy (a) In terms of spectral shape, how are atomic spectra different from molecular spectra? What is the source of this difference? (b) Describe the decision-making process for picking a line for atomic emission analysis of a given analyte. (c) For quality assurance, spike recovery is not sufficient to establish confidence in an analytical procedure. Explain this statement. What should be done instead to demonstrate satisfactory performance of an instrumental method (including elemental analysis). (d) Find a literature example of atomic spectroscopy used for elemental analysis. State the operating conditions with sufficient detail to reproduce the analysis; Please answer very soon will give rating surely All questions complete Answer needed Please help mearrow_forward
arrow_back_ios
SEE MORE QUESTIONS
arrow_forward_ios
Recommended textbooks for you
 Principles of Instrumental AnalysisChemistryISBN:9781305577213Author:Douglas A. Skoog, F. James Holler, Stanley R. CrouchPublisher:Cengage Learning
 Principles of Modern ChemistryChemistryISBN:9781305079113Author:David W. Oxtoby, H. Pat Gillis, Laurie J. ButlerPublisher:Cengage Learning
Principles of Instrumental Analysis
Chemistry
ISBN:9781305577213
Author:Douglas A. Skoog, F. James Holler, Stanley R. Crouch
Publisher:Cengage Learning
Principles of Modern Chemistry
Chemistry
ISBN:9781305079113
Author:David W. Oxtoby, H. Pat Gillis, Laurie J. Butler
Publisher:Cengage Learning
Photochemistry : Introduction to Basic Theory of Photochemical Process [Part 1]; Author: Dr. Vikrant Palekar;https://www.youtube.com/watch?v=2NDOL11d6no;License: Standard YouTube License, CC-BY
Photochemistry-1; Author: CH-08:ARYABHATT [Mathematics, Physics, Chemistry];https://www.youtube.com/watch?v=DC4J0t1z3e8;License: Standard Youtube License