
Essentials Of Statistics For Business & Economics
9th Edition
ISBN: 9780357045435
Author: David R. Anderson, Dennis J. Sweeney, Thomas A. Williams, Jeffrey D. Camm, James J. Cochran
Publisher: South-Western College Pub
expand_more
expand_more
format_list_bulleted
Concept explainers
Videos
Textbook Question
Chapter 15.5, Problem 20E
Refer to the data presented in exercise 2. The estimated regression equation for these data is
Here SST = 15,182.9, SSR = 14,052.2,
- a. Test for a significant relationship among x1, x2, and y. Use α = .05.
- b. Is β1 significant? Use α = .05.
- c. Is β2 significant? Use α = .05.
- 1. Consider the following data for a dependent variable y and two independent variables, x1 and x2.
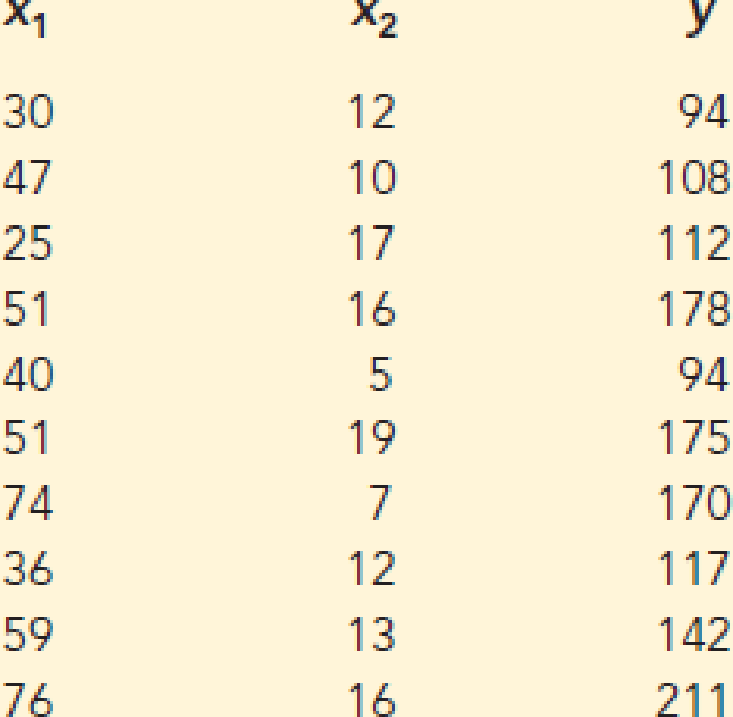
- a. Develop an estimated regression equation relating y to x1. Predict y if x1 = 47.
- b. Develop an estimated regression equation relating y to x2. Predict y if x2 = 10.
- c. Develop an estimated regression equation relating y to x1 and x2. Predict y if x1 = 47 and x2 = 10.
Expert Solution & Answer

Trending nowThis is a popular solution!

Students have asked these similar questions
For 40 eruptions of the Old Faithful geyser in Yellowstone National Park, duration times (sec) were recorded along with the heights (ft) of the eruptions. The linear correlation coefficient is r = 0.0915 and the regression equation is = 119 + 0.0331x, where x represents duration time. The mean of the 40 duration times is 245.0 sec and the mean of the 40 heights is 127.2 ft. What is the best predicted height of an eruption with a duration time of 120 min?
The table below gives the number of hours seven randomly selected students spent studying and their corresponding midterm exam grades. Using this data, consider the equation of the regression line, yˆ=b0+b1x�^=�0+�1�, for predicting the midterm exam grade that a student will earn based on the number of hours spent studying. Keep in mind, the correlation coefficient may or may not be statistically significant for the data given. Remember, in practice, it would not be appropriate to use the regression line to make a prediction if the correlation coefficient is not statistically significant.
Hours Studying
1
2
3
3.5
4
4.5
5
Midterm Grades
60
66
73
76
78
84
90
Table
Copy Data
Step 1 of 6:
Find the estimated slope. Round your answer to three decimal places.
The table below gives the number of hours seven randomly selected students spent studying and their corresponding midterm exam grades. Using this data, consider the equation of the regression line, yˆ=b0+b1x�^=�0+�1�, for predicting the midterm exam grade that a student will earn based on the number of hours spent studying. Keep in mind, the correlation coefficient may or may not be statistically significant for the data given. Remember, in practice, it would not be appropriate to use the regression line to make a prediction if the correlation coefficient is not statistically significant.
Hours Studying
11
1.51.5
2.52.5
33
44
4.54.5
55
Midterm Grades
6666
6969
7575
7979
9090
9595
9898
Find the estimated slope. Round your answer to three decimal places.
Find the estimated y-intercept. Round your answer to three decimal places.
Determine if the statement "Not all points predicted by the linear model fall on the same line" is true or false.…
Chapter 15 Solutions
Essentials Of Statistics For Business & Economics
Ch. 15.2 - The estimated regression equation for a model...Ch. 15.2 - Consider the following data for a dependent...Ch. 15.2 - 3. In a regression analysis involving 30...Ch. 15.2 - A shoe store developed the following estimated...Ch. 15.2 - Theater Revenue. The owner of Showtime Movie...Ch. 15.2 - NFL Winning Percentage. The National Football...Ch. 15.2 - Rating Computer Monitors. PC Magazine provided...Ch. 15.2 - Scoring Cruise Ships. The Condé Nast Traveler Gold...Ch. 15.2 - House Prices. Spring is a peak time for selling...Ch. 15.2 - Baseball Pitcher Performance. Major League...
Ch. 15.3 - In exercise 1, the following estimated regression...Ch. 15.3 - In exercise 2, 10 observations were provided for a...Ch. 15.3 - 13. In exercise 3, the following estimated...Ch. 15.3 - In exercise 4, the following estimated regression...Ch. 15.3 - Prob. 15ECh. 15.3 - 16. In exercise 6, data were given on the average...Ch. 15.3 - Quality of Fit in Predicting House Prices. Revisit...Ch. 15.3 - R2 in Predicting Baseball Pitcher Performance....Ch. 15.5 - In exercise 1, the following estimated regression...Ch. 15.5 - Refer to the data presented in exercise 2. The...Ch. 15.5 - The following estimated regression equation was...Ch. 15.5 - Testing Significance in Shoe Sales Prediction. In...Ch. 15.5 - Testing Significance in Theater Revenue. Refer to...Ch. 15.5 - Testing Significance in Predicting NFL Wins. The...Ch. 15.5 - Auto Resale Value. The Honda Accord was named the...Ch. 15.5 - Testing Significance in Baseball Pitcher...Ch. 15.6 - In exercise 1, the following estimated regression...Ch. 15.7 - Consider a regression study involving a dependent...Ch. 15.7 - Consider a regression study involving a dependent...Ch. 15.7 - 34. Management proposed the following regression...Ch. 15.7 - Repair Time. Refer to the Johnson Filtration...Ch. 15.7 - Extending Model for Repair Time. This problem is...Ch. 15.7 - Pricing Refrigerators. Best Buy, a nationwide...Ch. 15.9 - In Table 15.12 we provided estimates of the...Ch. 15 - 49. The admissions officer for Clearwater College...Ch. 15 - 50. The personnel director for Electronics...Ch. 15 - A partial computer output from a regression...Ch. 15 - Analyzing College Grade Point Average. Recall that...Ch. 15 - Analyzing Job Satisfaction. Recall that in...Ch. 15 - Analyzing Repeat Purchases. The Tire Rack,...Ch. 15 - Zoo Attendance. The Cincinnati Zoo and Botanical...Ch. 15 - Mutual Fund Returns. A portion of a data set...Ch. 15 - Gift Card Sales. For the holiday season of 2017,...Ch. 15 - Consumer Research, Inc., is an independent agency...Ch. 15 - Matt Kenseth won the 2012 Daytona 500, the most...Ch. 15 - When trying to decide what car to buy, real value...
Knowledge Booster


Learn more about
Need a deep-dive on the concept behind this application? Look no further. Learn more about this topic, statistics and related others by exploring similar questions and additional content below.Similar questions
- The table below gives the number of hours seven randomly selected students spent studying and their corresponding midterm exam grades. Using this data, consider the equation of the regression line, yˆ=b0+b1x�^=�0+�1�, for predicting the midterm exam grade that a student will earn based on the number of hours spent studying. Keep in mind, the correlation coefficient may or may not be statistically significant for the data given. Remember, in practice, it would not be appropriate to use the regression line to make a prediction if the correlation coefficient is not statistically significant. Hours Studying 1 2 3 3.5 4 4.5 5 Midterm Grades 60 66 73 76 78 84 90 Step 2 of 6: Find the estimated y-intercept. Round your answer to three decimal places. Step 3 of 6: Find the estimated value of y when x=2�=2. Round your answer to three decimal places. Step 4 of 6: Substitute the values you found in steps 1 and 2 into the equation for the regression line to find the estimated…arrow_forwardAs the value of correlation coefficient increases from 0 to 1, or decreases from 0 to -1, how do the points of the scatter plot fit the regression line?arrow_forwardThe following results are from data concerning the amount withdrawn from an ATM machine based on the amount of time spent at the ATM machine (SECONDS) and the gender, FEMALE (dummy variable = 1 for females and = 0 for males) and an interaction term, SECONDS*FEMALE Based on the regression results, what is the predicted amount withdrawn for a male who spends 20 at the ATM machine? (please express your answer using 1 decimal places)arrow_forward
- You spilled water on your calculations from (a) and can't remember what your estimated regression parameters are. But you do have two possible estimated errors for each of your initial four observations:arrow_forwardThe table below gives the number of absences and the overall grade in the class for seven randomly selected students. Based on this data, consider the equation of the regression line, yˆ=b0+b1x�^=�0+�1�, for using the number of absences to predict a student's overall grade in the class. Keep in mind, the correlation coefficient may or may not be statistically significant for the data given. Remember, in practice, it would not be appropriate to use the regression line to make a prediction if the correlation coefficient is not statistically significant. Number of Absences Grade1 3.72 3.33 3.14 2.96 2.47 2.28 1.9arrow_forwardThe table below gives the number of hours five randomly selected students spent studying and their corresponding midterm exam grades. Using this data, consider the equation of the regression line. ^y=b0+b1x for predicting the midterm exam grade that a student will earn based on the number of hours spent studying. Keep in mind, the correlation coefficient may or may not be statistically significant for the data given. Remember, in practice, it would not be appropriate to use the regression line to make a prediction if the correlation coefficient is not statistically significant. Hours Studying 2 3 4 5 6 Midterm Grades 60 81 86 98 100 Find the error prediction when x= 5. Round your answer to three decimal places. * What we know: Estimated slope b1=9.700Estimated intercept b0=46.200arrow_forward
- The table below gives the number of hours ten randomly selected students spent studying and their corresponding midterm exam grades. Using this data, consider the equation of the regression line, yˆ=b0+b1x, for predicting the midterm exam grade that a student will earn based on the number of hours spent studying. Keep in mind, the correlation coefficient may or may not be statistically significant for the data given. Remember, in practice, it would not be appropriate to use the regression line to make a prediction if the correlation coefficient is not statistically significant. Hours Studying 0 0.5 1.5 2 2.5 3 4.5 5 5.5 6 Midterms Grades 60 63 64 69 73 76 82 90 91 95 Step 1 of 6: Find the estimated slope. Round your answer to three decimal places. Step 2 of 6: Find the estimated y-intercept. Round your answer to three decimal places. Step 3 of 6: Determine if the statement "All points predicted by the linear model fall on the same line" is true or false Step 4 of 6:…arrow_forwardThe table below gives the number of hours ten randomly selected students spent studying and their corresponding midterm exam grades. Using this data, consider the equation of the regression line, y^=b0+b1x, for predicting the midterm exam grade that a student will earn based on the number of hours spent studying. Keep in mind, the correlation coefficient may or may not be statistically significant for the data given. Remember, in practice, it would not be appropriate to use the regression line to make a prediction if the correlation coefficient is not statistically significant. Hours Studying 0 1 2 2.5 3 3.5 4 4.5 5.5 6 Midterm Grades 61 64 65 66 71 79 84 88 94 98 Summation Table x y xy x2 y2 Student 1 0.0 61 0.0 0.00 3721 Student 2 1.0 64 64.0 1.00 4096 Student 3 2.0 65 130.0 4.00 4225 Student 4 2.5 66 165.0 6.25 4356 Student 5 3.0 71 213.0 9.00 5041 Student 6 3.5 79 276.5 12.25 6241 Student 7 4.0 84 336.0 16.00 7056 Student 8 4.5 88 396.0 20.25 7744…arrow_forwardAccording to World Health Organization (WHO), the recommended limit for a noise level inside a classroom is 35 dBA. However, nine out of ten schools fail to meet this recommendation. A researcher wishes to conduct a study relevant to the prior information, but as a gap, he decides to include the area (in square meters) of every classroom and how it could possibly affect the resulting noise level. He selects 17 classrooms at random, and the noise levels are recorded in the next slide. a. Find the regression equation and construct the scatter plot diagram. b. Predict the noise level if a classroom has an area of 85.97 m2 . c. Calculate the coefficient of determination and interpret the findings. d. Calculate the coefficient of alienation and interpret the findings. Use Excelarrow_forward
- The table below gives the number of hours spent unsupervised each day as well as the overall grade averages for seven randomly selected middle school students. Using this data, consider the equation of the regression line, yˆ=b0+b1x�^=�0+�1�, for predicting the overall grade average for a middle school student based on the number of hours spent unsupervised each day. Keep in mind, the correlation coefficient may or may not be statistically significant for the data given. Remember, in practice, it would not be appropriate to use the regression line to make a prediction if the correlation coefficient is not statistically significant. Hours Unsupervised 00 0.50.5 11 1.51.5 33 5.55.5 66 Overall Grades 9999 9797 8080 6969 6464 6363 6262 Step 2 of 6 : Find the estimated y-intercept. Round your answer to three decimal places.arrow_forwardThe table below gives the number of hours spent unsupervised each day as well as the overall grade averages for seven randomly selected middle school students. Using this data, consider the equation of the regression line, yˆ=b0+b1x�^=�0+�1�, for predicting the overall grade average for a middle school student based on the number of hours spent unsupervised each day. Keep in mind, the correlation coefficient may or may not be statistically significant for the data given. Remember, in practice, it would not be appropriate to use the regression line to make a prediction if the correlation coefficient is not statistically significant. Hours Unsupervised 00 11 1.51.5 22 2.52.5 44 4.54.5 Overall Grades 9797 9393 8585 7474 7272 7171 6666 Table Copy Data Step 1 of 6 : Find the estimated slope. Round your answer to three decimal places.arrow_forwardThe table below gives the number of hours five randomly selected students spent studying and their corresponding midterm exam grades. Using this data, consider the equation of the regression line, y^=b0+b1x, for predicting the midterm exam grade that a student will earn based on the number of hours spent studying. Keep in mind, the correlation coefficient may or may not be statistically significant for the data given. Remember, in practice, it would not be appropriate to use the regression line to make a prediction if the correlation coefficient is not statistically significant. Hours Studying 1 2 4 5 6 Midterm Grades 67 68 70 79 87 Summation Table x y xy x2 y2 Student 1 1 67 67 1 4489 Student 2 2 68 136 4 4624 Student 3 4 70 280 16 4900 Student 4 5 79 395 25 6241 Student 5 6 87 522 36 7569 Sum 18 371 1400 82 27823 Step 1 of 6: Find the estimated slope. Round your answer to three decimal places. Step 2 of 6: Find the estimated y-intercept. Round your…arrow_forward
arrow_back_ios
SEE MORE QUESTIONS
arrow_forward_ios
Recommended textbooks for you
 MATLAB: An Introduction with ApplicationsStatisticsISBN:9781119256830Author:Amos GilatPublisher:John Wiley & Sons Inc
 Probability and Statistics for Engineering and th...StatisticsISBN:9781305251809Author:Jay L. DevorePublisher:Cengage Learning
 Statistics for The Behavioral Sciences (MindTap C...StatisticsISBN:9781305504912Author:Frederick J Gravetter, Larry B. WallnauPublisher:Cengage Learning
 Elementary Statistics: Picturing the World (7th E...StatisticsISBN:9780134683416Author:Ron Larson, Betsy FarberPublisher:PEARSON
 The Basic Practice of StatisticsStatisticsISBN:9781319042578Author:David S. Moore, William I. Notz, Michael A. FlignerPublisher:W. H. Freeman
 Introduction to the Practice of StatisticsStatisticsISBN:9781319013387Author:David S. Moore, George P. McCabe, Bruce A. CraigPublisher:W. H. Freeman
MATLAB: An Introduction with Applications
Statistics
ISBN:9781119256830
Author:Amos Gilat
Publisher:John Wiley & Sons Inc
Probability and Statistics for Engineering and th...
Statistics
ISBN:9781305251809
Author:Jay L. Devore
Publisher:Cengage Learning
Statistics for The Behavioral Sciences (MindTap C...
Statistics
ISBN:9781305504912
Author:Frederick J Gravetter, Larry B. Wallnau
Publisher:Cengage Learning
Elementary Statistics: Picturing the World (7th E...
Statistics
ISBN:9780134683416
Author:Ron Larson, Betsy Farber
Publisher:PEARSON
The Basic Practice of Statistics
Statistics
ISBN:9781319042578
Author:David S. Moore, William I. Notz, Michael A. Fligner
Publisher:W. H. Freeman
Introduction to the Practice of Statistics
Statistics
ISBN:9781319013387
Author:David S. Moore, George P. McCabe, Bruce A. Craig
Publisher:W. H. Freeman
Correlation Vs Regression: Difference Between them with definition & Comparison Chart; Author: Key Differences;https://www.youtube.com/watch?v=Ou2QGSJVd0U;License: Standard YouTube License, CC-BY
Correlation and Regression: Concepts with Illustrative examples; Author: LEARN & APPLY : Lean and Six Sigma;https://www.youtube.com/watch?v=xTpHD5WLuoA;License: Standard YouTube License, CC-BY