
Concept explainers
Videos
Analyze Horsepower Hookup, Inc.
Horsepower Hookup, Inc., is a large automobile company that specializes in the production of high-powered trucks. The company is determining cost allocations for purposes of performance evaluation. A portion of company bonuses depends on divisions achieving cost management goals. This necessitates highly accurate support department cost allocation. Management has also stated that it has the means to implement as complex a method as necessary.
The general manager over the Mid-Size D wants to get a good idea of what factors are driving the costs of the support departments in order to make accurate cost allocations, so finding accurate support department cost drivers is important. Support department costs include Janitorial ($163,100) and Security ($285,400). The Janitorial costs vary depending on the number of vehicles produced, increasing with larger production volumes. Security costs are fixed based on the size of the lot, and do not change with respect to how many vehicles are in the lot or warehouse. Joint costs involved in producing the trucks before the split-off point where the various makes, models, and colors are produced are $946,000 for the period. All makes, models, and colors sell at relatively similar margins, but the sports models and metallic colors are normally more difficult to produce during the joint production process.
- a. Which support department cost allocation method (direct, sequential, or reciprocal services) should be used to allocate support department cost?
- b. What driver would be best for allocating Janitorial costs?
- c. What driver would be best for allocating Security costs?
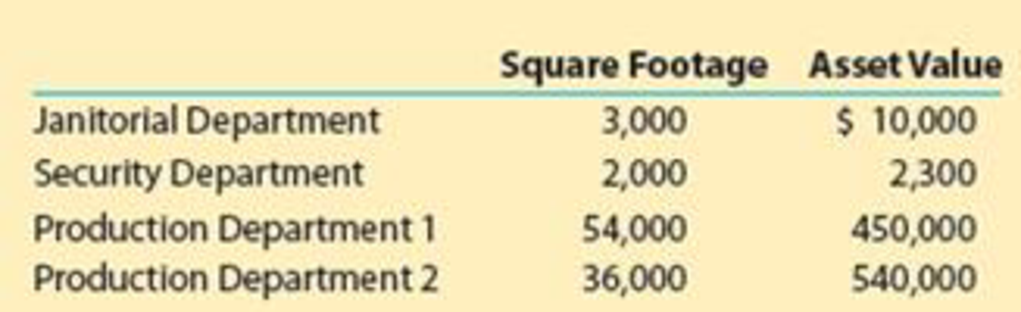
- d. If Janitorial costs were to be allocated based on square footage, and Security costs based on asset value, what percentage of each support department’s costs would be allocated to each production department using the sequential method (allocating Security costs first) given the following:
- e. Should Janitorial and Security costs be considered when evaluating the performance of cost management employees?
- f. What joint cost allocation method should be used for performance evaluation purposes?

Trending nowThis is a popular solution!

Chapter 19 Solutions
Financial And Managerial Accounting


- Two departments within Cougar Gear Inc. are Production and Sales. Each department has a unique scorecard, as follows: The Production Department scorecard focuses on the learning and growth and internal processes perspectives. The Sales Department scorecard focuses on the learning and growth and customer perspectives. Both scorecards have the learning and growth performance metrics of median training hours per employee and average employee tenure. The Production scorecard has the unique metrics of production time per unit and number of production shutdowns. The Sales scorecard has the unique metrics of percentage of customers who shop again and online customer satisfaction rating. The performance targets for each metric are shown in the tan boxes just under the performance metrics. The actual achieved metrics are shown in the red boxes just below the tan boxes. When evaluating both departments, Cougar Gears management looks at the median training hours per employee and average employee tenure metrics and subsequently decides to give the Sales Department a large bonus while giving the Production Department a minimal bonus. a. Determine and define the type of cognitive bias Cougar Gears management has exhibited in this instance. b. Determine which department would have received the larger bonus had the companys management not been biased in the evaluation. c. Discuss one advantage and one disadvantage of using unique balanced scorecards for different departments or divisions of a company.arrow_forwardJolene Askew, manager of Feagan Company, has committed her company to a strategically sound cost reduction program. Emphasizing life-cycle cost management is a major part of this effort. Jolene is convinced that production costs can be reduced by paying more attention to the relationships between design and manufacturing. Design engineers need to know what causes manufacturing costs. She instructed her controller to develop a manufacturing cost formula for a newly proposed product. Marketing had already projected sales of 25,000 units for the new product. (The life cycle was estimated to be 18 months. The company expected to have 50 percent of the market and priced its product to achieve this goal.) The projected selling price was 20 per unit. The following cost formula was developed: Y=200,000+10X1 where X1=Machinehours(Theproductisexpectedtouseonemachinehourforeveryunitproduced.) Upon seeing the cost formula, Jolene quickly calculated the projected gross profit to be 50,000. This produced a gross profit of 2 per unit, well below the targeted gross profit of 4 per unit. Jolene then sent a memo to the Engineering Department, instructing them to search for a new design that would lower the costs of production by at least 50,000 so that the target profit could be met. Within two days, the Engineering Department proposed a new design that would reduce unit-variable cost from 10 per machine hour to 8 per machine hour (Design Z). The chief engineer, upon reviewing the design, questioned the validity of the controllers cost formula. He suggested a more careful assessment of the proposed designs effect on activities other than machining. Based on this suggestion, the following revised cost formula was developed. This cost formula reflected the cost relationships of the most recent design (Design Z). Y=140,000+8X1+5,000X2+2,000X3 where X1=MachinehoursX2=NumberofbatchesX3=Numberofengineeringchangeorders Based on scheduling and inventory considerations, the product would be produced in batches of 1,000; thus, 25 batches would be needed over the products life cycle. Furthermore, based on past experience, the product would likely generate about 20 engineering change orders. This new insight into the linkage of the product with its underlying activities led to a different design (Design W). This second design also lowered the unit-level cost by 2 per unit but decreased the number of design support requirements from 20 orders to 10 orders. Attention was also given to the setup activity, and the design engineer assigned to the product created a design that reduced setup time and lowered variable setup costs from 5,000 to 3,000 per setup. Furthermore, Design W also creates excess activity capacity for the setup activity, and resource spending for setup activity capacity can be decreased by 40,000, reducing the fixed cost component in the equation by this amount. Design W was recommended and accepted. As prototypes of the design were tested, an additional benefit emerged. Based on test results, the post-purchase costs dropped from an estimated 0.70 per unit sold to 0.40 per unit sold. Using this information, the Marketing Department revised the projected market share upward from 50 percent to 60 percent (with no price decrease). Required: 1. Calculate the expected gross profit per unit for Design Z using the controllers original cost formula. According to this outcome, does Design Z reach the targeted unit profit? Repeat, using the engineers revised cost formula. Explain why Design Z failed to meet the targeted profit. What does this say about the use of unit-based costing for life-cycle cost management? 2. Calculate the expected profit per unit using Design W. Comment on the value of activity information for life-cycle cost management. 3. The benefit of the post-purchase cost reduction of Design W was discovered in testing. What direct benefit did it create for Feagan Company (in dollars)? Reducing post-purchase costs was not a specific design objective. Should it have been? Are there any other design objectives that should have been considered?arrow_forwardCommunication The controller of New Wave Sounds Inc. prepared the following product profitability report for management, using activity-based costing methods for allocating both the factory overhead and the marketing expenses. As such, the controller has confidence in the accuracy of this report. In addition, the controller interviewed the vice president of marketing, who provided the following insight into the companys three products: The home theater speakers are an older product that is highly recognized in the marketplace. The wireless speakers are a new product that was just recently launched. The wireless headphones are a new technology that has no competition in the marketplace, and it is hoped that they will become an important future addition to the companys product portfolio. Initial indications are that the product is well received by customers. The controller believes that the manufacturing costs for all three products are in line with expectations. Based on the information provided: 1. Calculate the ratio of gross profit to sales and the ratio of operating income to sales for each product. 2. Write a brief (one-page) memo using the product profitability report and the calculations in (a) to make recommendations to management with respect to strategies for the three products.arrow_forward
- Tom Young, vice president of Dunn Company (a producer of plastic products), has been supervising the implementation of an activity-based cost management system. One of Toms objectives is to improve process efficiency by improving the activities that define the processes. To illustrate the potential of the new system to the president, Tom has decided to focus on two processes: production and customer service. Within each process, one activity will be selected for improvement: molding for production and sustaining engineering for customer service. (Sustaining engineers are responsible for redesigning products based on customer needs and feedback.) Value-added standards are identified for each activity. For molding, the value-added standard calls for nine pounds per mold. (Although the products differ in shape and function, their size, as measured by weight, is uniform.) The value-added standard is based on the elimination of all waste due to defective molds (materials is by far the major cost for the molding activity). The standard price for molding is 15 per pound. For sustaining engineering, the standard is 60 percent of current practical activity capacity. This standard is based on the fact that about 40 percent of the complaints have to do with design features that could have been avoided or anticipated by the company. Current practical capacity (the first year) is defined by the following requirements: 18,000 engineering hours for each product group that has been on the market or in development for five years or less, and 7,200 hours per product group of more than five years. Four product groups have less than five years experience, and 10 product groups have more. There are 72 engineers, each paid a salary of 70,000. Each engineer can provide 2,000 hours of service per year. There are no other significant costs for the engineering activity. For the first year, actual pounds used for molding were 25 percent above the level called for by the value-added standard; engineering usage was 138,000 hours. There were 240,000 units of output produced. Tom and the operational managers have selected some improvement measures that promise to reduce non-value-added activity usage by 30 percent in the second year. Selected actual results achieved for the second year are as follows: The actual prices paid per pound and per engineering hour are identical to the standard or budgeted prices. Required: 1. For the first year, calculate the non-value-added usage and costs for molding and sustaining engineering. Also, calculate the cost of unused capacity for the engineering activity. 2. Using the targeted reduction, establish kaizen standards for molding and engineering (for the second year). 3. Using the kaizen standards prepared in Requirement 2, compute the second-year usage variances, expressed in both physical and financial measures, for molding and engineering. (For engineering, explain why it is necessary to compare actual resource usage with the kaizen standard.) Comment on the companys ability to achieve its targeted reductions. In particular, discuss what measures the company must take to capture any realized reductions in resource usage.arrow_forwardGrate Care Company specializes in producing products for personal grooming. The company operates six divisions, including the Hair Products Division. Each division is treated as an investment center. Managers are evaluated and rewarded on the basis of ROI performance. Only those managers who produce the best ROIs are selected to receive bonuses and to fill higher-level managerial positions. Fred Olsen, manager of the Hair Products Division, has always been one of the top performers. For the past two years, Freds division has produced the largest ROI; last year, the division earned an operating income of 2.56 million and employed average operating assets valued at 16 million. Fred is pleased with his divisions performance and has been told that if the division does well this year, he will be in line for a headquarters position. For the coming year, Freds division has been promised new capital totaling 1.5 million. Any of the capital not invested by the division will be invested to earn the companys required rate of return (9 percent). After some careful investigation, the marketing and engineering staff recommended that the division invest in equipment that could be used to produce a crimping and waving iron, a product currently not produced by the division. The cost of the equipment was estimated at 1.2 million. The divisions marketing manager estimated operating earnings from the new line to be 156,000 per year. After receiving the proposal and reviewing the potential effects, Fred turned it down. He then wrote a memo to corporate headquarters, indicating that his division would not be able to employ the capital in any new projects within the next eight to 10 months. He did note, however, that he was confident that his marketing and engineering staff would have a project ready by the end of the year. At that time, he would like to have access to the capital. Required: 1. Explain why Fred Olsen turned down the proposal to add the capability of producing a crimping and waving iron. Provide computations to support your reasoning. 2. Compute the effect that the new product line would have on the profitability of the firm as a whole. Should the division have produced the crimping and waving iron? 3. Suppose that the firm used residual income as a measure of divisional performance. Do you think Freds decision might have been different? Why? 4. Explain why a firm like Grate Care might decide to use both residual income and return on investment as measures of performance. 5. Did Fred display ethical behavior when he turned down the investment? In discussing this issue, consider why he refused to allow the investment.arrow_forwardJoseph Fox, controller of Thorpe Company, has been in charge of a project to install an activity-based cost management system. This new system is designed to support the companys efforts to become more competitive. For the past six weeks, he and the project committee members have been identifying and defining activities, associating workers with activities, and assessing the time and resources consumed by individual activities. Now, he and the project committee are focusing on three additional implementation issues: (1) identifying activity drivers, (2) assessing value content, and (3) identifying cost drivers (root causes). Joseph has assigned a committee member the responsibilities of assessing the value content of five activities, choosing a suitable activity driver for each activity, and identifying the possible root causes of the activities. Following are the five activities with possible activity drivers: The committee member ran a regression analysis for each potential activity driver, using the method of least squares to estimate the variable and fixed cost components. In all five cases, costs were highly correlated with the potential drivers. Thus, all drivers appeared to be good candidates for assigning costs to products. The company plans to reward production managers for reducing product costs. Required: 1. What is the difference between an activity driver and a cost driver? In answering the question, describe the purpose of each type of driver. 2. For each activity, assess the value content and classify each activity as value-added or non-value-added (justify the classification). Identify some possible root causes of each activity, and describe how this knowledge can be used to improve activity performance. For purposes of discussion, assume that the value-added activities are not performed with perfect efficiency. 3. Describe the behavior that each activity driver will encourage, and evaluate the suitability of that behavior for the companys objective of becoming more competitive.arrow_forward
- Coulson and Company is a large retail business that has a firm-wide balanced scorecard. Recently, management has discussed the need for the balanced scorecard to be more relevant to each individual department of the company. Specifically, management wants to come up with unique scorecards for its Public Relations and Inventory Management departments. For both departments, management recognizes that properly and efficiently training employees is important. For these purposes, management gathers data on the median training hours per employee and new employee performance review ratings. For the Inventory Management Department, management is focused on reducing stockouts (running out of certain inventory items) and keeping accurate inventory counts. For these purposes, the company tracks the number of back orders and discrepancies between the physical and record counts of inventory, respectively. For the Public Relations Department, management is focused on improving the publics CSR image of the company and attracting new customers. Management measures these objectives using Forbes CSR Rating of Coulson and Company and the number of new customers, respectively. a. Identify the term for Coulson and Companys plan to create unique balanced scorecards for its individual departments. b. Draw the unique balanced scorecards of each department. Identify the departments common and unique measures, and include all the elements of the balanced scorecard that you can in your drawings, given the information provided.arrow_forwardRandy Harris, controller, has been given the charge to implement an advanced cost management system. As part of this process, he needs to identify activity drivers for the activities of the firm. During the past four months, Randy has spent considerable effort identifying activities, their associated costs, and possible drivers for the activities costs. Initially, Randy made his selections based on his own judgment using his experience and input from employees who perform the activities. Later, he used regression analysis to confirm his judgment. Randy prefers to use one driver per activity, provided that an R2 of at least 80 percent can be produced. Otherwise, multiple drivers will be used, based on evidence provided by multiple regression analysis. For example, the activity of inspecting finished goods produced an R2 of less than 80 percent for any single activity driver. Randy believes, however, that a satisfactory cost formula can be developed using two activity drivers: the number of batches and the number of inspection hours. Data collected for a 14-month period are as follows: Required: 1. Calculate the cost formula for inspection costs using the two drivers, inspection hours and number of batches. Are both activity drivers useful? What does the R2 indicate about the formula? 2. Using the formula developed in Requirement 1, calculate the inspection cost when 300 inspection hours are used and 30 batches are produced. Prepare a 90 percent confidence interval for this prediction.arrow_forwardAs manager of department B in MarIeys Manufacturing, based on the costs you identified in the previous exercise for further research, how does this impact the financial performance of your department, and what might be some questions you want to ask or solutions you might propose to Marleys management?arrow_forward
- Kagle design engineers are in the process of developing a new green product, one that will significantly reduce impact on the environment and yet still provide the desired customer functionality. Currently, two designs are being considered. The manager of Kagle has told the engineers that the cost for the new product cannot exceed 550 per unit (target cost). In the past, the Cost Accounting Department has given estimated costs using a unit-based system. At the request of the Engineering Department, Cost Accounting is providing both unit-and activity-based accounting information (made possible by a recent pilot study producing the activity-based data). Unit-based system: Variable conversion activity rate: 100 per direct labor hour Material usage rate: 20 per part ABC system: Labor usage: 15 per direct labor hour Material usage (direct materials): 20 per part Machining: 75 per machine hour Purchasing activity: 150 per purchase order Setup activity: 3,000 per setup hour Warranty activity: 500 per returned unit (usually requires extensive rework) Customer repair cost: 25 per repair hour (average) Required: 1. Select the lower-cost design using unit-based costing. Are logistical and post-purchase activities considered in this analysis? 2. Select the lower-cost design using ABC analysis. Explain why the analysis differs from the unit-based analysis. 3. What if the post-purchase cost was an environmental contaminant and amounted to 10 per unit for Design A and 40 per unit for Design B? Assume that the environmental cost is borne by society. Now which is the better design?arrow_forwardJohn Thomas, vice president of Mallett Company (a producer of a variety of plastic products), has been supervising the implementation of an ABC management system. John wants to improve process efficiency by improving the activities that define the processes. To illustrate the potential of the new system to the president, John has decided to focus on two processes: production and customer service. Within each process, one activity will be selected for improvement: materials usage for production and sustaining engineering for customer service (sustaining engineers are responsible for redesigning products based on customer needs and feedback). Value-added standards are identified for each activity. For materials usage, the value-added standard calls for six pounds per unit of output (the products differ in shape and function, but their weight is uniform). The value-added standard is based on the elimination of all waste due to defective molds. The standard price of materials is 5 per pound. For sustaining engineering, the standard is 58% of current practical activity capacity. This standard is based on the fact that about 42% of the complaints have to do with design features that could have been avoided or anticipated by the company. Current practical capacity (at the end of 20X1) is defined by the following requirements: 6,000 engineering hours for each product group that has been on the market or in development for 5 years or less and 2,400 hours per product group of more than 5 years. Four product groups have less than 5 years experience, and 10 product groups have more. Each of the 24 engineers is paid a salary of 60,000. Each engineer can provide 2,000 hours of service per year. No other significant costs are incurred for the engineering activity. Actual materials usage for 20X1 was 25% above the level called for by the value-added standard; engineering usage was 46,000 hours. A total of 80,000 units of output were produced. John and the operational managers have selected some improvement measures that promise to reduce nonvalue-added activity usage by 40% in 20X2. Selected actual results achieved for 20X2 are as follows: The actual prices paid for materials and engineering hours are identical to the standard or budgeted prices. Required: 1. For 20X1, calculate the nonvalue-added usage and costs for materials usage and sustaining engineering. 2. CONCEPTUAL CONNECTION Using the budgeted improvements, calculate the expected activity usage levels for 20X2. Now, compute the 20X2 usage variances (the difference between the expected and actual values), expressed in both physical and financial measures, for materials and engineering. Comment on the companys ability to achieve its targeted reductions. In particular, discuss what measures the company must take to capture any realized reductions in resource usage.arrow_forwardRefer to the data in Exercise 7.18. When the capacity of the HR Department was originally established, the normal usage expected for each department was 20,000 direct labor hours. This usage is also the amount of activity planned for the two departments in Year 1 and Year 2. Required: 1. Allocate the costs of the HR Department using the direct method and assuming that the purpose is product costing. 2. Allocate the costs of the HR Department using the direct method and assuming that the purpose is to evaluate performance.arrow_forward
 Managerial AccountingAccountingISBN:9781337912020Author:Carl Warren, Ph.d. Cma William B. TaylerPublisher:South-Western College PubFinancial And Managerial AccountingAccountingISBN:9781337902663Author:WARREN, Carl S.Publisher:Cengage Learning,
 Cornerstones of Cost Management (Cornerstones Ser...AccountingISBN:9781305970663Author:Don R. Hansen, Maryanne M. MowenPublisher:Cengage Learning
 Essentials of Business Analytics (MindTap Course ...StatisticsISBN:9781305627734Author:Jeffrey D. Camm, James J. Cochran, Michael J. Fry, Jeffrey W. Ohlmann, David R. AndersonPublisher:Cengage Learning
 Managerial Accounting: The Cornerstone of Busines...AccountingISBN:9781337115773Author:Maryanne M. Mowen, Don R. Hansen, Dan L. HeitgerPublisher:Cengage Learning
 Principles of Accounting Volume 2AccountingISBN:9781947172609Author:OpenStaxPublisher:OpenStax College