Videos
Evaluating division performance over time
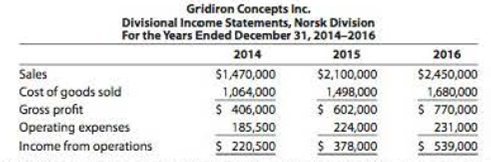
The Norsk Division of Gridiron Concepts Inc. has been experiencing revenue and profit growth during the years 2014-2016. The divisional income statements follow:
Assume that there are no charges from Service departments. The vice president of the division, Tom Yang, is proud of his division’s performance over the last three years. The president of Gridiron Concepts Inc., Anna Evans, is discussing the division’s performance with Tom, as follows:
Tom: As you can see, we’ve had a successful three years in the Norsk Division.
Anna: I’m not too sure.
Tom: What do you mean? Look at our results. Our income from operations has more than doubled, while our profit margins are improving.
Anna: I am looking at your results. However, your income statements fail to include one very important piece of information, namely, the invested assets. You have been investing a great deal of assets into the division. You had $735,000 in invested assets in 2014, $1,500,000 in 2014 and $3,500,000 in 2016.
Tom: You are right. I’ve needed the assets in order to upgrade our technologies and expand our operations. The additional assets are one reason we have been able to grow and improve our profit margins. I don’t see that this is a problem.
Anna: The problem is that we must maintain a 15%
- 1. Determine the profit margins for the Norsk Division for 2014-2016.
- 2. Compute the investment turn over for the Norsk Division for 2014-2016. Round to two decimal places.
- 3. Compute the rate of return on investment for the Norsk Division for 2014-2016.
- 4. Evaluate the division’s performance over the 2014-2016 time period. Why was Anna concerned about the performance?
(1)
Profit margin: This ratio gauges the operating profitability by quantifying the amount of income earned from business operations from the sales generated.
Formula of profit margin:
To compute: Profit margin of N Division for the years 2014 to 2016
Explanation of Solution
Determine profit margin of N Division for the year 2014.
Determine profit margin of N Division for the year 2015.
Determine profit margin of N Division for the year 2016.
(2)
Investment turnover: This ratio gauges the operating efficiency by quantifying the amount of sales generated from the assets invested.
Formula of investment turnover:
To compute: Investment turnover of N Division for the years 2014 to 2016.
Explanation of Solution
Determine investment turnover of N Division for the year 2014.
Determine investment turnover of N Division for the year 2015.
Determine investment turnover of N Division for the year 2016.
(3)
Return on investment (ROI): This financial ratio evaluates how efficiently the assets are used in earning income from operations. So, ROI is a tool used to measure and compare the performance of a units or divisions or a companies.
Formula of ROI:
To compute: Return on investment (ROI) of N Division for the years 2014 to 2016
Explanation of Solution
Determine ROI of N Division for the year 2014.
Determine ROI of N Division for the year 2015.
Determine ROI of N Division for the year 2016.
(4)
To evaluate: Division N’s performance
Explanation of Solution
Evaluation of N Division’s performance:
By observing the operating results of N Division, the gross profit, income from operations, and revenues, it can be concluded that the performance of the division has increased considerably from 2014 to 2016. To know the actual performance, RPOI is computed in an extended form by using the profit margin, investment turnover as follows:
For 2014:
For 2015:
For 2016:
These computations show that the profitability of the division deteriorated from 2014 to 2016, due to the drop in investment turnover. So, the investments could not earn the required income, leading to decreased ROI. The assets invested were unable to earn the enough revenue.
This is a decreasing trend in the division’s performance.
Want to see more full solutions like this?
Chapter 23 Solutions
Financial & Managerial Accounting


- Dantrell Palmer has just been appointed manager of Kirchner Glass Products Division. He has two years to make the division profitable. If the division is still showing a loss after two years, it will be eliminated, and Dantrell will be reassigned as an assistant divisional manager in another division. The divisional income statement for the most recent year is as follows: Upon arriving at the division, Dantrell requested the following data on the divisions three products: He also gathered data on a proposed new product (Product D). If this product is added, it would displace one of the current products; the quantity that could be produced and sold would equal the quantity sold of the product it displaces, although demand limits the maximum quantity that could be sold to 20,000 units. Because of specialized production equipment, it is not possible for the new product to displace part of the production of a second product. The information on Product D is as follows: Required: 1. Prepare segmented income statements for Products A, B, and C. 2. Determine the products that Dantrell should produce for the coming year. Prepare segmented income statements that prove your combination is the best for the division. By how much will profits improve given the combination that you selected? (Hint: Your combination may include one, two, or three products.)arrow_forwardBill Fremont, division controller and CMA, was upset by a recent memo he received from the divisional manager, Steve Preston. Bill was scheduled to present the divisions financial performance at headquarters in one week. In the memo, Steve had given Bill some instructions for this upcoming report. In particular, Bill had been told to emphasize the significant improvement in the divisions profits over last year. Bill, however, didnt believe that there was any real underlying improvement in the divisions performance and was reluctant to say otherwise. He knew that the increase in profits was because of Steves conscious decision to produce more inventory. In an earlier meeting, Steve had convinced his plant managers to produce more than they knew they could sell. He argued that by deferring some of this periods fixed costs, reported profits would jump. He pointed out two significant benefits. First, by increasing profits, the division could exceed the minimum level needed so that all the managers would qualify for the annual bonus. Second, by meeting the budgeted profit level, the division would be better able to compete for much-needed capital. Bill objected but had been overruled. The most persuasive counterargument was that the increase in inventory could be liquidated in the coming year as the economy improved. Bill, however, considered this event unlikely. From past experience, he knew that it would take at least two years of improved market demand before the productive capacity of the division was exceeded. Required: 1. Discuss the behavior of Steve Preston, the divisional manager. Was the decision to produce for inventory an ethical one? 2. What should Bill Fremont do? Should he comply with the directive to emphasize the increase in profits? If not, what options does he have? 3. Chapter 1 listed ethical standards for management accountants. Identify any standards that apply in this situation.arrow_forwardKent Tessman, manager of a Dairy Products Division, was pleased with his divisions performance over the past three years. Each year, divisional profits had increased, and he had earned a sizable bonus. (Bonuses are a linear function of the divisions reported income.) He had also received considerable attention from higher management. A vice president had told him in confidence that if his performance over the next three years matched his first three, he would be promoted to higher management. Determined to fulfill these expectations, Kent made sure that he personally reviewed every capital budget request. He wanted to be certain that any funds invested would provide good, solid returns. (The divisions cost of capital is 10 percent.) At the moment, he is reviewing two independent requests. Proposal A involves automating a manufacturing operation that is currently labor intensive. Proposal B centers on developing and marketing a new ice cream product. Proposal A requires an initial outlay of 250,000, and Proposal B requires 312,500. Both projects could be funded, given the status of the divisions capital budget. Both have an expected life of six years and have the following projected after-tax cash flows: After careful consideration of each investment, Kent approved funding of Proposal A and rejected Proposal B. Required: 1. Compute the NPV for each proposal. 2. Compute the payback period for each proposal. 3. According to your analysis, which proposal(s) should be accepted? Explain. 4. Explain why Kent accepted only Proposal A. Considering the possible reasons for rejection, would you judge his behavior to be ethical? Explain.arrow_forward
- Forchen, Inc., provided the following information for two of its divisions for last year: Required: 1. For the Small Appliances Division, calculate: a. Average operating assets b. Margin c. Turnover d. Return on investment (ROI) 2. For the Cleaning Products Division, calculate: a. Average operating assets b. Margin c. Turnover d. Return on investment (ROI) 3. What if operating income for the Small Appliances Division was 2,000,000? How would that affect average operating assets? Margin? Turnover? ROI? Calculate any changed ratios (round to four significant digits).arrow_forwardJarriot, Inc., presented two years of data for its Furniture Division and its Houseware Division. Required: 1. Compute the ROI and the margin and turnover ratios for each year for the Furniture Division. (Round your answers to four significant digits.) 2. Compute the ROI and the margin and turnover ratios for each year for the Houseware Division. (Round your answers to four significant digits.) 3. Explain the change in ROI from Year 1 to Year 2 for each division.arrow_forwardIn 20x5, Major Company initiated a full-scale, quality improvement program. At the end of the year, Jack Aldredge, the president, noted with some satisfaction that the defects per unit of product had dropped significantly compared to the prior year. He was also pleased that relationships with suppliers had improved and defective materials had declined. The new quality training program was also well accepted by employees. Of most interest to the president, however, was the impact of the quality improvements on profitability. To help assess the dollar impact of the quality improvements, the actual sales and the actual quality costs for 20x4 and 20x5 are as follows by quality category: All prevention costs are fixed (by discretion). Assume all other quality costs are unit-level variable. Required: 1. Compute the relative distribution of quality costs for each year and prepare a pie chart. Do you believe that the company is moving in the right direction in terms of the balance among the quality cost categories? Explain. 2. Prepare a one-year trend performance report for 20x5 (compare the actual costs of 20x5 with those of 20x4, adjusted for differences in sales volume). How much have profits increased because of the quality improvements made by Major Company? 3. Estimate the additional improvement in profits if Major Company ultimately reduces its quality costs to 2.5 percent of sales revenues (assume sales of 10 million).arrow_forward
- “I know headquarters wants us to add that new product line,” said Dell Havasi, manager of Billings Company’s Office Products Division. “But I want to see the numbers before I make any move. Our division’s return on investment (ROI) has led the company for three years, and I don’t want any letdown.” Billings Company is a decentralized wholesaler with five autonomous divisions. The divisions are evaluated on the basis of ROI, with year-end bonuses given to the divisional managers who have the highest ROIs. Operating results for the company’s Office Products Division for this year are given below: Sales $ 22,505,000 Variable expenses 14,105,500 Contribution margin 8,399,500 Fixed expenses 6,145,000 Net operating income $ 2,254,500 Divisional average operating assets $ 4,687,500 The company had an overall return on investment (ROI) of 17.00% this year (considering all divisions). Next year the Office Products Division has an opportunity to add a new product line that…arrow_forward“I know headquarters wants us to add that new product line,” said Dell Havasi, manager of Billings Company’s Office Products Division. “But I want to see the numbers before I make any move. Our division’s return on investment (ROI) has led the company for three years, and I don’t want any letdown.” Billings Company is a decentralized wholesaler with five autonomous divisions. The divisions are evaluated on the basis of ROI, with year-end bonuses given to the divisional managers who have the highest ROIs. Operating results for the company’s Office Products Division for this year are given below: Sales $ 22,505,000 Variable expenses 14,105,500 Contribution margin 8,399,500 Fixed expenses 6,145,000 Net operating income $ 2,254,500 Divisional average operating assets $ 4,687,500 The company had an overall return on investment (ROI) of 17.00% this year (considering all divisions). Next year the Office Products Division has an opportunity to add a new product line that…arrow_forward“I know headquarters wants us to add that new product line,” said Dell Havasi, manager of Billings Company’s Office Products Division. “But I want to see the numbers before I make any move. Our division’s return on investment (ROI) has led the company for three years, and I don’t want any letdown.” Billings Company is a decentralized wholesaler with five autonomous divisions. The divisions are evaluated on the basis of ROI, with year-end bonuses given to the divisional managers who have the highest ROIs. Operating results for the company’s Office Products Division for this year are given below: Sales $ 22,900,000 Variable expenses 14,313,400 Contribution margin 8,586,600 Fixed expenses 6,205,000 Net operating income $ 2,381,600 Divisional average operating assets $ 4,580,000 The company had an overall return on investment (ROI) of 17.00% this year (considering all divisions). Next year the Office Products Division has an opportunity to add a new product line that…arrow_forward
- “I know headquarters wants us to add that new product line,” said Dell Havasi, manager of Billings Company’s Office Products Division. “But I want to see the numbers before I make any move. Our division’s return on investment (ROI) has led the company for three years, and I don’t want any letdown.” Billings Company is a decentralized wholesaler with five autonomous divisions. The divisions are evaluated on the basis of ROI, with year-end bonuses given to the divisional managers who have the highest ROIs. Operating results for the company’s Office Products Division for this year are given below: Sales $ 22,900,000 Variable expenses 14,313,400 Contribution margin 8,586,600 Fixed expenses 6,205,000 Net operating income $ 2,381,600 Divisional average operating assets $ 4,580,000 The company had an overall return on investment (ROI) of 17.00% this year (considering all divisions). Next year the Office Products Division has an opportunity to add a new product line that…arrow_forwardI know headquarters wants us to add that new product line,” said Dell Havasi, manager of Billings Company’s Office Products Division. “But I want to see the numbers before I make any move. Our division’s return on investment (ROI) has led the company for three years, and I don’t want any letdown.” Billings Company is a decentralized wholesaler with five autonomous divisions. The divisions are evaluated on the basis of ROI, with year-end bonuses given to the divisional managers who have the highest ROIs. Operating results for the company’s Office Products Division for this year are given below: Sales $ 23,000,000 Variable expenses 14,365,000 Contribution margin 8,635,000 Fixed expenses 6,220,000 Net operating income $ 2,415,000 Divisional average operating assets $ 5,001,000 The company had an overall return on investment (ROI) of 16.00% this year (considering all divisions). Next year the Office Products Division has an opportunity to add a new…arrow_forward“I know headquarters wants us to add that new product line,” said Dell Havasi, manager of Billings Company’s Office Products Division. “But I want to see the numbers before I make a decision. Our division’s return on investment (ROI) has led the company for three years, and I don’t want any letdown.” Billings Company is a decentralized wholesaler with five autonomous divisions. The divisions are evaluated using ROI, with year-end bonuses given to the divisional managers who have the highest ROIs. Operating results for the company’s Office Products Division for this year are given below: Sales $ 22,440,000 Variable expenses 14,094,600 Contribution margin 8,345,400 Fixed expenses 6,130,000 Net operating income $ 2,215,400 Divisional average operating assets $ 4,480,000 The company had an overall return on investment (ROI) of 18.00% this year (considering all divisions). Next year the Office Products Division has an opportunity to add a new product requiring $2,430,600 of…arrow_forward
 Financial And Managerial AccountingAccountingISBN:9781337902663Author:WARREN, Carl S.Publisher:Cengage Learning,
 Managerial AccountingAccountingISBN:9781337912020Author:Carl Warren, Ph.d. Cma William B. TaylerPublisher:South-Western College Pub
 Cornerstones of Cost Management (Cornerstones Ser...AccountingISBN:9781305970663Author:Don R. Hansen, Maryanne M. MowenPublisher:Cengage Learning
 Managerial Accounting: The Cornerstone of Busines...AccountingISBN:9781337115773Author:Maryanne M. Mowen, Don R. Hansen, Dan L. HeitgerPublisher:Cengage Learning