
Concept explainers
Videos
(a)
To find: that is it reasonable to conclude heart or respiratory diseases.
(a)
Answer to Problem 11E
Reasonable
Explanation of Solution
Given:
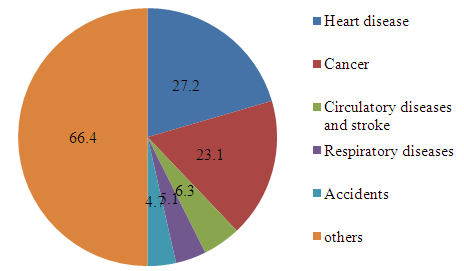
| Cause of Death | Percent |
| Heart disease | 27.2 |
| Cancer | 23.1 |
| Circulatory diseases and stroke | 6.3 |
| Respiratory diseases | 5.1 |
| Accidents | 4.7 |
Only one cause of death of every patient that is no patient has more than one reason of death. It means there is no category overlap so relative frequencies could be added. For the deaths cause by the heart or respiratory disease is
27.2% + 5.1% = 33% (approximately)
Therefore it is reasonable to conclude that respiratory or hear diseases were the cause of about 33% of U.S. deaths in 2003
(b)
To find: the percent of death were from causes not listed here.
(b)
Answer to Problem 11E
66.4%
Explanation of Solution
Total percent of deaths by the causes is
27.2% + 23.1% + 6.3% +5.1% 4.7% = 66.4%
Therefore, the percent of deaths from causes not listed here
100% - 66.4% = 33.6%
(c)
To Explain: an appropriate represent for these data.
(c)
Answer to Problem 11E
Bar chart
Explanation of Solution
Given:
| Cause of Death | Percent |
| Heart disease | 27.2 |
| Cancer | 23.1 |
| Circulatory diseases and stroke | 6.3 |
| Respiratory diseases | 5.1 |
| Accidents | 4.7 |
| Others | 66.4 |
Graph:
There is total addition of the number is 100 percent so the bar chart would be good to use.
Chapter 3 Solutions
Stats: Modeling the World Nasta Edition Grades 9-12
Additional Math Textbook Solutions
Essentials of Statistics, Books a la Carte Edition (5th Edition)
Elementary Statistics
Statistics for Business and Economics (13th Edition)
Elementary Statistics (13th Edition)
Essentials of Statistics (6th Edition)
Elementary Statistics: Picturing the World (6th Edition)


 MATLAB: An Introduction with ApplicationsStatisticsISBN:9781119256830Author:Amos GilatPublisher:John Wiley & Sons Inc
 Probability and Statistics for Engineering and th...StatisticsISBN:9781305251809Author:Jay L. DevorePublisher:Cengage Learning
 Statistics for The Behavioral Sciences (MindTap C...StatisticsISBN:9781305504912Author:Frederick J Gravetter, Larry B. WallnauPublisher:Cengage Learning
 Elementary Statistics: Picturing the World (7th E...StatisticsISBN:9780134683416Author:Ron Larson, Betsy FarberPublisher:PEARSON
 The Basic Practice of StatisticsStatisticsISBN:9781319042578Author:David S. Moore, William I. Notz, Michael A. FlignerPublisher:W. H. Freeman
 Introduction to the Practice of StatisticsStatisticsISBN:9781319013387Author:David S. Moore, George P. McCabe, Bruce A. CraigPublisher:W. H. Freeman