
Concept explainers
Videos
(a)
To find: the percent of total drivers are under 20.
(a)
Answer to Problem 35E
4.7%
Explanation of Solution
Given:
Calculation:
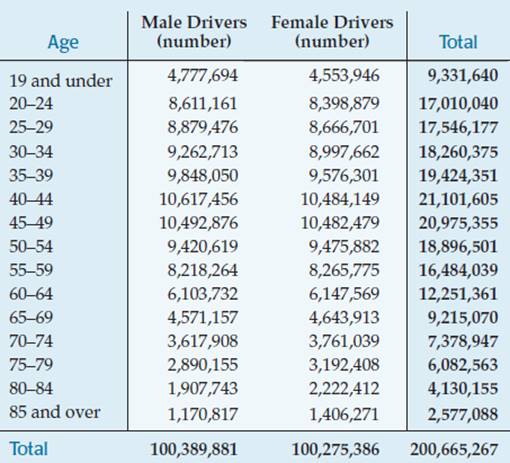
Total number of driver under age 20 = 93311640
Total number of driver = 200,665,267.
Therefore, the percent of total drivers under age 20 is
Therefore, the percentage of total drivers under age 20 is 4.7%.
(b)
To find: the percent of total drivers are male.
(b)
Answer to Problem 35E
50%
Explanation of Solution
Given:

Calculation:
Total number of male drivers =100,389, 881
Total number of drivers =200,665,267.
Therefore the percentage of male drivers is
Therefore, the percentage of male drivers is 50.0%.
(c)
To Explain: the few sentences comparing the number of female and male.
(c)
Explanation of Solution
Given:
Calculation:
Percentage of female and male licensed drivers in many age groups
| Age | Male Driver (%) | Female Driver (%) |
| 19 and under | 51.2 | 48.8 |
| 20-24 | 50.6 | 49.4 |
| 25-29 | 50.6 | 49.4 |
| 30-34 | 50.7 | 49.3 |
| 35-39 | 50.7 | 49.3 |
| 40-44 | 50.3 | 49.7 |
| 45-49 | 50 | 50 |
| 50-54 | 49.9 | 50.1 |
| 55-59 | 49.9 | 50.1 |
| 60-64 | 49.8 | 50.2 |
| 65-69 | 49.6 | 50.4 |
| 70-74 | 49 | 51 |
| 75-79 | 47.5 | 52.5 |
| 80-84 | 46.2 | 53.8 |
| 85 and over | 45.4 | 54.6 |
Graph:
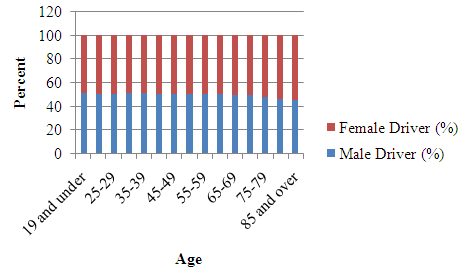
By seeing the graph, it is noticed that there is all equal number of male and female drivers in age group but as the age is increasing number of female drivers is also increasing in comparison to male drivers.
(d)
To Explain: that the Driver’s age and Sex represent to be independent.
(d)
Explanation of Solution
By seeing the graph, it is noticed that there is all equal number of male and female drivers in age group but as the age is increasing number of female drivers is also increasing in comparison to male drivers. Therefore there is very easy association but a slight association between driver’s age and sex.
Chapter 3 Solutions
Stats: Modeling the World Nasta Edition Grades 9-12
Additional Math Textbook Solutions
Elementary Statistics
Introductory Statistics
Introductory Statistics
Elementary Statistics Using Excel (6th Edition)


 MATLAB: An Introduction with ApplicationsStatisticsISBN:9781119256830Author:Amos GilatPublisher:John Wiley & Sons Inc
 Probability and Statistics for Engineering and th...StatisticsISBN:9781305251809Author:Jay L. DevorePublisher:Cengage Learning
 Statistics for The Behavioral Sciences (MindTap C...StatisticsISBN:9781305504912Author:Frederick J Gravetter, Larry B. WallnauPublisher:Cengage Learning
 Elementary Statistics: Picturing the World (7th E...StatisticsISBN:9780134683416Author:Ron Larson, Betsy FarberPublisher:PEARSON
 The Basic Practice of StatisticsStatisticsISBN:9781319042578Author:David S. Moore, William I. Notz, Michael A. FlignerPublisher:W. H. Freeman
 Introduction to the Practice of StatisticsStatisticsISBN:9781319013387Author:David S. Moore, George P. McCabe, Bruce A. CraigPublisher:W. H. Freeman