
Videos
(a)
To find: the problem encounters and makes a display of the given data.
(a)
Explanation of Solution
Given:
| Country | Medals | Country | Medals |
| Germany | 29 | Finland | 9 |
| United States | 24 | Czech Republic | 4 |
| Canada | 24 | Estonia | 3 |
| Austria | 23 | Croatia | 3 |
| Russia | 22 | Australia | 2 |
| Norway | 19 | Poland | 2 |
| Sweden | 14 | Ukraine | 2 |
| Switzerland | 14 | Japan | 1 |
| South Korea | 11 | Belarus | 1 |
| Italy | 11 | Bulgaria | 1 |
| China | 11 | Great Britain | 1 |
| France | 9 | Slovakia | 1 |
| Netherlands | 9 | Latvia | 1 |
Graph:
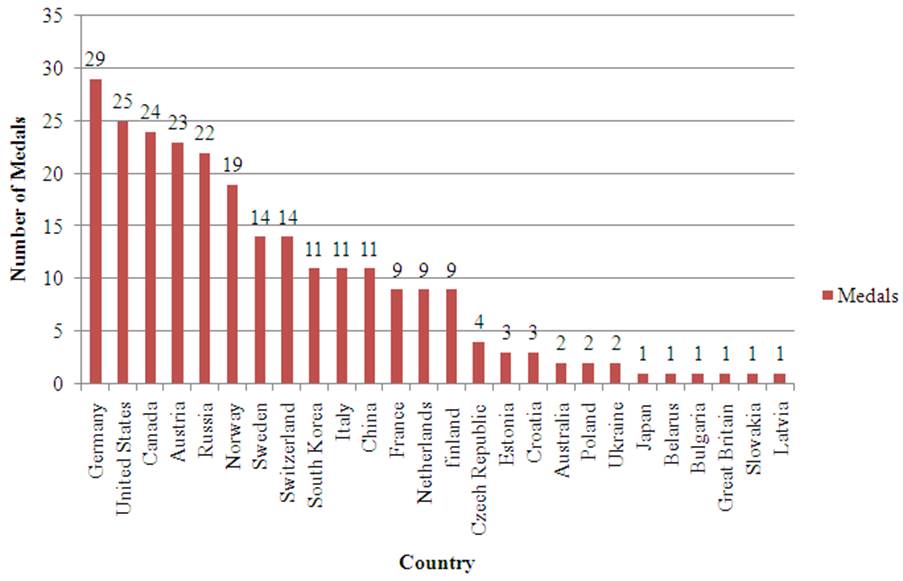
By seeing the data, it can be represent in the form of the bar chart, the reason is that there is no overlap, therefore it displays data properly. The analysis of the graph is not easy because there are total 26 bars
(b)
To find: the way to organize the data so that the graph is more successful.
(b)
Explanation of Solution
Given:
| Country | Medals | Country | Medals |
| Germany | 29 | Finland | 9 |
| United States | 24 | Czech Republic | 4 |
| Canada | 24 | Estonia | 3 |
| Austria | 23 | Croatia | 3 |
| Russia | 22 | Australia | 2 |
| Norway | 19 | Poland | 2 |
| Sweden | 14 | Ukraine | 2 |
| Switzerland | 14 | Japan | 1 |
| South Korea | 11 | Belarus | 1 |
| Italy | 11 | Bulgaria | 1 |
| China | 11 | Great Britain | 1 |
| France | 9 | Slovakia | 1 |
| Netherlands | 9 | Latvia | 1 |
Graph:
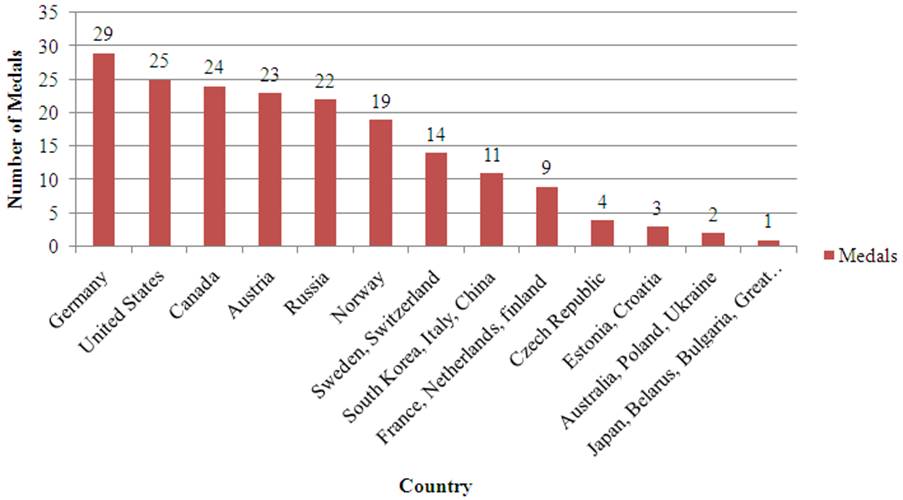
Making the group of the countries in a category which are having the same number of medals and make the graph, it is easy to analyse.
Chapter 3 Solutions
Stats: Modeling the World Nasta Edition Grades 9-12
Additional Math Textbook Solutions
Introductory Statistics (10th Edition)
Statistical Reasoning for Everyday Life (5th Edition)
STATS:DATA+MODELS-W/DVD
Basic Business Statistics, Student Value Edition
An Introduction to Mathematical Statistics and Its Applications (6th Edition)
Elementary Statistics (13th Edition)


 MATLAB: An Introduction with ApplicationsStatisticsISBN:9781119256830Author:Amos GilatPublisher:John Wiley & Sons Inc
 Probability and Statistics for Engineering and th...StatisticsISBN:9781305251809Author:Jay L. DevorePublisher:Cengage Learning
 Statistics for The Behavioral Sciences (MindTap C...StatisticsISBN:9781305504912Author:Frederick J Gravetter, Larry B. WallnauPublisher:Cengage Learning
 Elementary Statistics: Picturing the World (7th E...StatisticsISBN:9780134683416Author:Ron Larson, Betsy FarberPublisher:PEARSON
 The Basic Practice of StatisticsStatisticsISBN:9781319042578Author:David S. Moore, William I. Notz, Michael A. FlignerPublisher:W. H. Freeman
 Introduction to the Practice of StatisticsStatisticsISBN:9781319013387Author:David S. Moore, George P. McCabe, Bruce A. CraigPublisher:W. H. Freeman