
Concept explainers
Videos
(a)
To find: the conditional distribution of the political views for the females.
(a)
Explanation of Solution
Given:
| L | M | C | Total | |
| Female | 35 | 36 | 6 | 77 |
| Male | 50 | 44 | 21 | 115 |
| 85 | 80 | 27 | 192 |
Calculation:
| L | M | C | Total | |
| Female | 35 | 36 | 6 | 77 |
This is the required conditional distribution of the political views for the females where most of the moderate and liberal.
(b)
To find: the conditional distributions of political views for the males.
(b)
Explanation of Solution
Given:
| L | M | C | Total | |
| Female | 35 | 36 | 6 | 77 |
| Male | 50 | 44 | 21 | 115 |
| 85 | 80 | 27 | 192 |
Calculation:
| L | M | C | Total | |
| Male | 50 | 44 | 21 | 115 |
This is the required conditional distributions of political views for the males where the highest are the liberal.
(c)
To construct: a graphical display that compares the two distributions.
(c)
Explanation of Solution
Given:
| L | M | C | Total | |
| Female | 35 | 36 | 6 | 77 |
| Male | 50 | 44 | 21 | 115 |
| 85 | 80 | 27 | 192 |
Calculation:
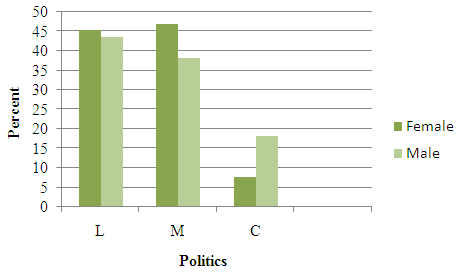
This is the required graphical display that compares the two distributions.
(d)
To find: that the variable Politics and Sex represent to be independent.
(d)
Explanation of Solution
Given:
| L | M | C | Total | |
| Female | 35 | 36 | 6 | 77 |
| Male | 50 | 44 | 21 | 115 |
| 85 | 80 | 27 | 192 |
By seeing the graph, it is observed that in part (c) the both the distributions are most of similar. But male appears to be more conservative than female therefore the variables Sex and Politics are not independent.
Chapter 3 Solutions
Stats: Modeling the World Nasta Edition Grades 9-12
Additional Math Textbook Solutions
Introductory Statistics (2nd Edition)
Statistics for Business and Economics (13th Edition)
Statistics: The Art and Science of Learning from Data (4th Edition)
Introductory Statistics
Elementary Statistics
Elementary Statistics: Picturing the World (7th Edition)


 MATLAB: An Introduction with ApplicationsStatisticsISBN:9781119256830Author:Amos GilatPublisher:John Wiley & Sons Inc
 Probability and Statistics for Engineering and th...StatisticsISBN:9781305251809Author:Jay L. DevorePublisher:Cengage Learning
 Statistics for The Behavioral Sciences (MindTap C...StatisticsISBN:9781305504912Author:Frederick J Gravetter, Larry B. WallnauPublisher:Cengage Learning
 Elementary Statistics: Picturing the World (7th E...StatisticsISBN:9780134683416Author:Ron Larson, Betsy FarberPublisher:PEARSON
 The Basic Practice of StatisticsStatisticsISBN:9781319042578Author:David S. Moore, William I. Notz, Michael A. FlignerPublisher:W. H. Freeman
 Introduction to the Practice of StatisticsStatisticsISBN:9781319013387Author:David S. Moore, George P. McCabe, Bruce A. CraigPublisher:W. H. Freeman