
Concept explainers
Videos
(a)
To find: the marginal distribution of blood pressure level.
(a)
Explanation of Solution
Given:
| under 30 | 30 to 39 | over 50 | |
| Low | 27 | 37 | 31 |
| Normal | 48 | 91 | 93 |
| High | 23 | 51 | 73 |
Calculation:
The marginal distribution
“Low” level blood pressure:
Similarly, for other levels of blood pressures
The marginal distribution of blood pressure level
| Blood Pressure | Marginal distribution | |
| Low | ||
| Normal | ||
| High |
(b)
To find: the conditional distribution of blood pressure level within each age group.
(b)
Explanation of Solution
Given:
| under 30 | 30 to 39 | over 50 | |
| Low | 27 | 37 | 31 |
| Normal | 48 | 91 | 93 |
| High | 23 | 51 | 73 |
Calculation:
Calculate the conditional distribution if blood pressure level within each age group.
Consider age Under 30.
Conditional distribution of low blood pressure level
Similarly, for all levels within every age group
The conditional distribution of blood pressure level within each age group:
| Blood pressure | Age | |||
| Under 30 | 30-49 | Over 50 | ||
| Low | ||||
| Normal | ||||
| High | ||||
(c)
To find: the comparison these distributions with a segmented bar graph.
(c)
Explanation of Solution
Given:
| under 30 | 30 to 39 | over 50 | |
| Low | 27 | 37 | 31 |
| Normal | 48 | 91 | 93 |
| High | 23 | 51 | 73 |
Graph:
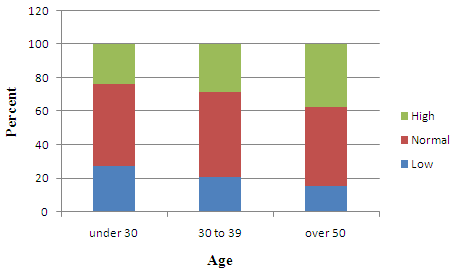
This is the required graph of the comparison these distributions with a segmented bar graph.
(d)
To Explain: the brief description of the association between blood pressure and age.
(d)
Explanation of Solution
Given:
| under 30 | 30 to 39 | over 50 | |
| Low | 27 | 37 | 31 |
| Normal | 48 | 91 | 93 |
| High | 23 | 51 | 73 |
Yes, there is an association between blood pressure and age among these employees. As the age of the employee increases, percent of employee with high blood pressure increases. And among over 50 employees, there is less employees with low blood pressure.
(e)
To Explain: that people’s blood pressure increases as they age.
(e)
Explanation of Solution
Given:
| under 30 | 30 to 39 | over 50 | |
| Low | 27 | 37 | 31 |
| Normal | 48 | 91 | 93 |
| High | 23 | 51 | 73 |
No, it does not represent that the people blood pressure increase with age. But it shows that in the peoples whose age over 50 chances of high blood pressure increases.
Chapter 3 Solutions
Stats: Modeling the World Nasta Edition Grades 9-12
Additional Math Textbook Solutions
Essentials of Statistics, Books a la Carte Edition (5th Edition)
Statistics for Psychology
Elementary Statistics (13th Edition)
Basic Business Statistics, Student Value Edition
Basic Business Statistics, Student Value Edition (13th Edition)


 MATLAB: An Introduction with ApplicationsStatisticsISBN:9781119256830Author:Amos GilatPublisher:John Wiley & Sons Inc
 Probability and Statistics for Engineering and th...StatisticsISBN:9781305251809Author:Jay L. DevorePublisher:Cengage Learning
 Statistics for The Behavioral Sciences (MindTap C...StatisticsISBN:9781305504912Author:Frederick J Gravetter, Larry B. WallnauPublisher:Cengage Learning
 Elementary Statistics: Picturing the World (7th E...StatisticsISBN:9780134683416Author:Ron Larson, Betsy FarberPublisher:PEARSON
 The Basic Practice of StatisticsStatisticsISBN:9781319042578Author:David S. Moore, William I. Notz, Michael A. FlignerPublisher:W. H. Freeman
 Introduction to the Practice of StatisticsStatisticsISBN:9781319013387Author:David S. Moore, George P. McCabe, Bruce A. CraigPublisher:W. H. Freeman