
Videos
Use following formation for P4-15 and P4-16:
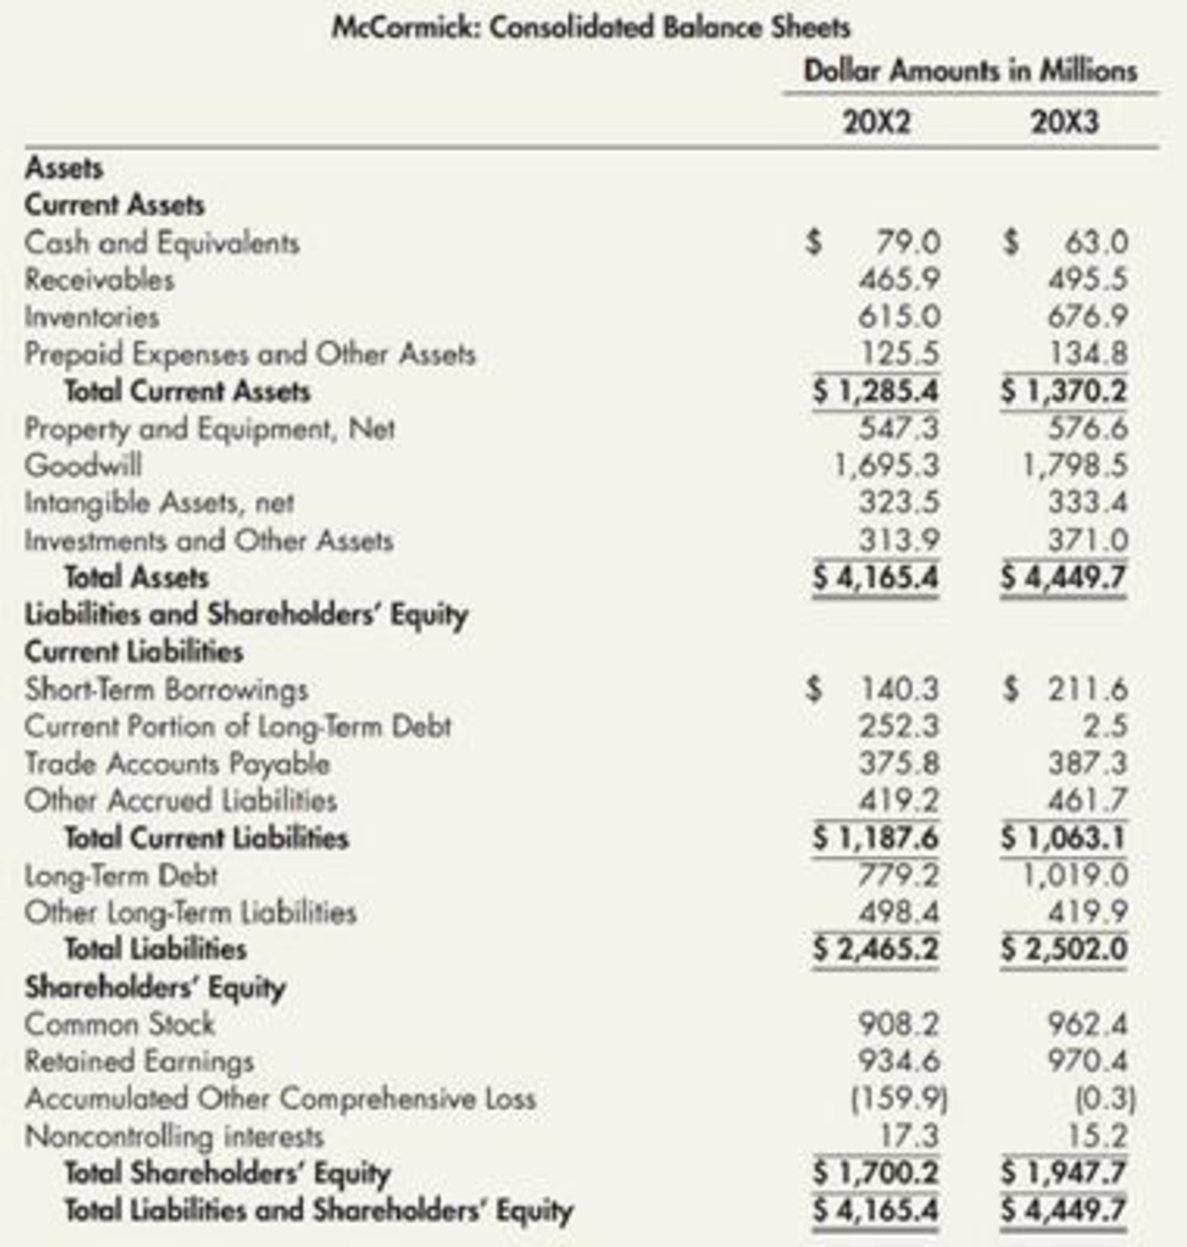
McCormick & Company, Inc. is one of the world’s leading producers of spices, herbs, seasonings, condiments, and other flavorings for foods. Its products are sold to consumers, with some of the leading brands of spices and seasonings, as well as to industrial producers of foods. McCormick’s consolidated balance sheets for 20X2 and 20X3 follow.
Common-Size and Rate of Change Analyses: McCormick Refer to the information for McCormick above.
Required:
Compute the common size balance sheet for 20X3 and the rate of change balance sheet for 20X3. Which two asset accounts and which two liabilities and shareholders’ equity accounts are the largest relative to total assets in 20X3? Which two asset accounts and which two liability and shareholders’ equity accounts grew at the fastest rates in 20X3? (Note: You may find it helpful to enter the data into an Excel spreadsheet for these computations.)

Trending nowThis is a popular solution!

Chapter 4 Solutions
Intermediate Accounting: Reporting And Analysis


- Use the following information for P417 and P418: The Hershey Company is one of the worlds leading producers of chocolates, candies, and confections. It sells chocolates and candies, mints and gums, baking ingredients, toppings, and beverages. Hersheys consolidated balance sheets for 20X2 and 20X3 follow. Ratios Analysis: Hershey Refer to the information for Hershey On the preceding page. Additional information for 20X3 is as follows (amounts in millions): Required: Next Level Compute the following ratios for 20X3. Provide a brief description of what each ratio reveals about Hershey. 1. return on common equity 2. debt-to-assets 3. debt-to-equity 4. current 5. quick (Hershey uses cash and equivalents, short terms securities, and receivables in their quick ratio calculation.) 6. inventory turnover days 7. accounts receivable turnover days 8. accounts payable turnover days 9. operating cycle (in days) 10. total asset turnoverarrow_forwardI need help with answers 8,9 & 10 Ratios Analysis: McCormick McCormick & Company, Inc. is one of the world's leading producers of spices, herbs, seasonings, condiments, and other flavorings for foods. Its products are sold to consumers, with some of the leading brands of spices and seasonings, as well as to industrial producers of foods. McCormick's consolidated balance sheets for 2012 and 2013 follow. McCormick: Consolidated Balance Sheets Dollar Amounts in Millions 2012 2013 Assets Current Assets Cash and Equivalents $ 79.0 $ 63.0 Receivables 465.9 495.5 Inventories 615.0 676.9 Prepaid Expenses and Other Assets 125.5 134.8 Total Current Assets $ 1,285.4 $ 1,370.2 Property and Equipment, Net 547.3 576.6 Goodwill 1,695.3 1,798.5 Intangible Assets, net 323.5 333.4 Investments and Other Assets 313.9 371.0 Total Assets $ 4,165.4 $ 4,449.7 Liabilities and Shareholders' Equity Current Liabilities Short-Term Borrowings…arrow_forwardThe Crunchy Granola Company is a diversified food company that specializes in all natural foods. The company has three operating divisions organized as investment centers. Condensed data taken from the records of the three divisions for the year ended June 30, 20Y7, are as follows: Line Item Description CerealDivision Snack CakeDivision RetailBakeries Division Sales $25,000,000 $8,000,000 $9,750,000 Cost of goods sold 16,670,000 5,575,000 6,795,000 Operating expenses 7,330,000 1,945,000 2,272,500 Invested assets 10,000,000 4,000,000 6,500,000 The management of The Crunchy Granola Company is evaluating each division as a basis for planning a future expansion of operations. Required: Question Content Area 1. Prepare condensed divisional income statements for the three divisions, assuming that there were no support department allocations. The Crunchy Granola CompanyDivisional Income StatementsFor the Year Ended June 30, 20Y7 Line Item…arrow_forward
- The Crunchy Granola Company is a diversified food company that specializes in all natural foods. The company has three operating divisions organized as investment centers. Condensed data taken from the records of the three divisions for the year ended June 30, 20Y7, are as follows: Cereal Division Snack Cake Division Retail Bakeries Division Sales $25,900,000 $8,100,000 $9,800,000 Cost of goods sold 16,620,000 5,560,000 6,700,000 Operating expenses 7,726,000 1,973,000 2,414,000 Invested assets 10,360,000 2,025,000 6,533,333 The management of The Crunchy Granola Company is evaluating each division as a basis for planning a future expansion of operations. Required: 1. Prepare condensed divisional income statements for the three divisions, assuming that there were no service department charges. 2. Using the DuPont formula for return on investment, compute the profit margin, investment turnover, and return on investment for each division. If…arrow_forwardRatios Analysis: McCormick McCormick & Company, Inc. is one of the world's leading producers of spices, herbs, seasonings, condiments, and other flavorings for foods. Its products are sold to consumers, with some of the leading brands of spices and seasonings, as well as to industrial producers of foods. McCormick's consolidated balance sheets for 2012 and 2013 follow. McCormick: Consolidated Balance Sheets Dollar Amounts in Millions 2012 2013 Assets Current Assets Cash and Equivalents $ 79.0 $ 63.0 Receivables 465.9 495.5 Inventories 615.0 676.9 Prepaid Expenses and Other Assets 125.5 134.8 Total Current Assets $ 1,285.4 $ 1,370.2 Property and Equipment, Net 547.3 576.6 Goodwill 1,695.3 1,798.5 Intangible Assets, net 323.5 333.4 Investments and Other Assets 313.9 371.0 Total Assets $ 4,165.4 $ 4,449.7 Liabilities and Shareholders' Equity Current Liabilities Short-Term Borrowings $ 140.3 $ 211.6 Current Portion of…arrow_forwardKrispy Kreme Doughnuts, Inc. (KKD) is a leading retailer and wholesaler of doughnuts. Krispy Kreme owns or franchises more than 1,100 stores where the “hot" light tells you if doughnuts are cooking. Dunkin* Brands Group, Inc. (DNKN) is a leading franchisor of doughnut (Dunkin' Donuts) and ice cream (Baskin-Robbins) shops with more than 20,000 stores worldwide. Selected financial statement information for a recent year for both companies follows (in thousands): a. Determine the days' cash on hand for each company. Round all calculations to one decimal place.b. Which company appears to have the stronger cash liquidity position?arrow_forward
- GF Foods Company is a large, primarily domestic, consumer foods company involved in the manufacture, distribution, and sale of a variety of food products. Industry averages are derived from Troy’s The Almanac of Business and Industrial Financial Ratios. Following are the 2024 and 2023 comparative balance sheets for IGF. (The financial data we use are from actual financial statements of a well-known corporation, but the company name used is fictitious, and the numbers and dates have been modified slightly.) IGF FOODS COMPANY Comparative Balance Sheets Years Ended December 31, 2024 and 2023 ($ in millions) 2024 2023 Assets Current assets: Cash $ 48 $ 142 Accounts receivable 347 320 Marketable securities 358 – Inventories 914 874 Prepaid expenses 212 154 Total current assets $ 1,879 $ 1,490 Property, plant, and equipment (net) 2,592 2,291 Intangibles (net) 800 843 Other assets 74 60 Total assets $ 5,345 $ 4,684 Liabilities and Shareholders’…arrow_forwardDivisional Income Statements and Return on Investment Analysis The Crunchy Granola Company is a diversified food company that specializes in all natural foods. The company has three operating divisions organized as investment centers. Condensed data taken from the records of the three divisions for the year ended June 30, 20Y7, are as follows: CerealDivision Snack CakeDivision RetailBakeries Division Sales $25,000,000 $8,000,000 $9,750,000 Cost of goods sold 16,670,000 5,575,000 6,795,000 Operating expenses 7,330,000 1,945,000 2,272,500 Invested assets 10,000,000 4,000,000 6,500,000 The management of The Crunchy Granola Company is evaluating each division as a basis for planning a future expansion of operations. Required: Prepare condensed divisional income statements for the three divisions, assuming that there were no support department allocations. The…arrow_forwardCentury Company, a diversified manufacturing company, had four separate operating divisions engaged in the manufacture of products in each of the following areas: food products, health aids, textiles, and office equipment. Financial data for the 2 years ended December 31, 2020 and 2019 are presented here: Net Sales 2020 2019 Food products $3,500,000 $3,000,000 Health aids 2,000,000 1,270,000 Textiles 1,580,000 1,400,000 Office equipment 920,000 1,330,000 $8,000,000 $7,000,000 Cost of Sales 2020 2019 Food products $2,400,000 $1,800,000 Health aids 1,100,000 700,000 Textiles 500,000 900,000 Office equipment 800,000 1,000,000 $4,800,000 $4,400,000 Operating Expenses 2020 2019 Food products $ 600,000 $ 300,000 Health aids 250,000 150,000 Textiles 200,000 100,000 Office equipment 650,000 750,000 $1,700,000 $1,300,000 On January 1, 2020, Century adopted a plan to sell the assets and product line of the office equipment…arrow_forward
- Proctor & Gamble (PG) and Church & Dwight (CHD) are two iconic American consumer products companies with histories dating back to the mid-1800s and producing familiar products such as Tide, Bounty, Crest, Arm and Hammer, OxiClean, and Waterpik. Both companies primarily sell their products to retailers such as grocery stores, drug stores and other mass merchants In evaluating the two companies, it was determined that PG is approximately 15 times larger than CHD based on sales. A convenient way to analyze financial results when companies are of different sizes is through ratio analysis. Obtain the financial statements of PG for the year ended June 30, 2021, and CHD for the year ended December 31, 2021, and compute the following ratios for both companies. 1. Accounts receivable turnover for 2021 2. Inventory turnover for 2021 3. P/E (price/earnings) ratio using the 2021 diluted EPS and the most current stock price of the company (attach a screenshot of the current stock price…arrow_forwardProctor & Gamble (PG) and Church & Dwight (CHD) are two iconic American consumer products companies with histories dating back to the mid-1800s and producing familiar products such as Tide, Bounty, Crest, Arm and Hammer, OxiClean, and Waterpik. Both companies primarily sell their products to retailers such as grocery stores, drug stores and other mass merchants In evaluating the two companies, it was determined that PG is approximately 15 times larger than CHD based on sales. A convenient way to analyze financial results when companies are of different sizes is through ratio analysis. Obtain the financial statements of PG for the year ended June 30, 2021, and CHD for the year ended December 31, 2021, and compute the following ratios for both companies. 1. Gross Profit % for 2021 and gross profit 2020 2. Income from operations (operating income) as a % of net sales for 2021 and for 2020. 3. Current ratio for 2021 and 2020 See following information for CHG company CHURCH…arrow_forwardToxaway Company is a merchandiser that segments its business into two divisions—Commercial and Residential. The company’s accounting intern was asked to prepare segmented income statements that the company’s divisional managers could use to calculate their break-even points and make decisions. She took the prior month’s companywide income statement and prepared the absorption format segmented income statement shown below: TotalCompany Commercial Residential Sales $ 750,000 $ 250,000 $ 500,000 Cost of goods sold 500,000 140,000 360,000 Gross margin 250,000 110,000 140,000 Selling and administrative expenses 240,000 104,000 136,000 Net operating income $ 10,000 $ 6,000 $ 4,000 In preparing these statements, the intern determined that Toxaway’s only variable selling and administrative expense is a 10% sales commission on all sales. The company’s total fixed expenses include $72,000 of common fixed expenses that…arrow_forward
- Intermediate Accounting: Reporting And AnalysisAccountingISBN:9781337788281Author:James M. Wahlen, Jefferson P. Jones, Donald PagachPublisher:Cengage Learning
 Financial And Managerial AccountingAccountingISBN:9781337902663Author:WARREN, Carl S.Publisher:Cengage Learning,
 Managerial AccountingAccountingISBN:9781337912020Author:Carl Warren, Ph.d. Cma William B. TaylerPublisher:South-Western College Pub