Concept explainers
Videos
CURRENT DESIGNS
As you teamed in the previous chapters. Current Designs has two main product lines—composite kayaks, which are handmade and very labor intensive, and rotomolded kayaks, which require less labor but employ more expensive equipment. Current Designs' controller, Diane Buswell, is now evaluating several different methods of assigning
Diane has decided to use the following activities and costs to evaluate the methods of assigning overhead.
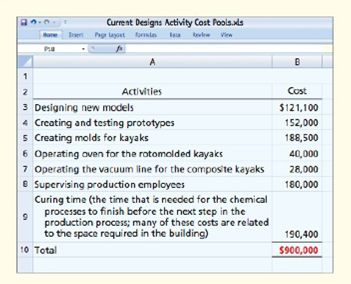
As Diane examines the data, she decides that the cost of operating the oven for the rotomolded kayaks and the cost of operating the vacuum line for the composite kayaks can be directly assigned to each of these product lines and do not need to be allocated with the other costs.
Instructions
For purposes of this analysis, assume that Current Designs uses $234,000 in direct labor costs to produce 1,000 composite kayaks and $286,000 in direct labor costs to produce 4,000 rotomolded kayaks each year.
(a) One method of allocating overhead would allocate the common costs to each product line by using an allocation basis such as the number of employees working on each type of kayak or the amount of factory space used for the production of each type of kayak. Diane knows that about 50% of the area of the plant and 50% of the employees work on the composite kayaks, and the remaining space and other employees work on the rotomolded kayaks. Using this information and remembering that the cost of operating the oven and vacuum line have been directly assigned, determine the total amount to be assigned to the composite kayak line and the rotomolded kayak line, and the amount to be assigned to each of the units in each line.
(b) Another method of allocating overhead is to use direct labor dollars as an allocation basis. Remembering that the costs of the oven and the vacuum line have been assigned directly to the product lines, allocate the remaining costs using direct labor dollars as the allocation basis. Then, determine the amount of overhead that should be assigned to each unit of each product line using this method.
(c) Activity-based costing requires a cost driver for each cost pool. Use the following information to assign the costs to the product lines using the activity-based costing approach.
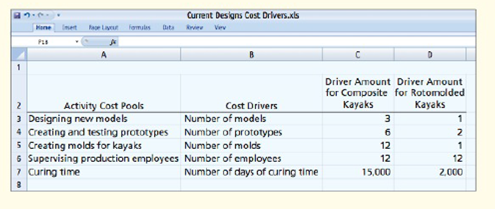 What amount of overhead should be assigned to each composite kayak using this method? What amount of overhead should be assigned to each rotomolded kayak using this method?
(d) Which of the three methods do you think Current Designs should use? Why?
Want to see the full answer?
Check out a sample textbook solution
Chapter 4 Solutions
Managerial Accounting: Tools for Business Decision Making


- Randy Harris, controller, has been given the charge to implement an advanced cost management system. As part of this process, he needs to identify activity drivers for the activities of the firm. During the past four months, Randy has spent considerable effort identifying activities, their associated costs, and possible drivers for the activities costs. Initially, Randy made his selections based on his own judgment using his experience and input from employees who perform the activities. Later, he used regression analysis to confirm his judgment. Randy prefers to use one driver per activity, provided that an R2 of at least 80 percent can be produced. Otherwise, multiple drivers will be used, based on evidence provided by multiple regression analysis. For example, the activity of inspecting finished goods produced an R2 of less than 80 percent for any single activity driver. Randy believes, however, that a satisfactory cost formula can be developed using two activity drivers: the number of batches and the number of inspection hours. Data collected for a 14-month period are as follows: Required: 1. Calculate the cost formula for inspection costs using the two drivers, inspection hours and number of batches. Are both activity drivers useful? What does the R2 indicate about the formula? 2. Using the formula developed in Requirement 1, calculate the inspection cost when 300 inspection hours are used and 30 batches are produced. Prepare a 90 percent confidence interval for this prediction.arrow_forwardTom Young, vice president of Dunn Company (a producer of plastic products), has been supervising the implementation of an activity-based cost management system. One of Toms objectives is to improve process efficiency by improving the activities that define the processes. To illustrate the potential of the new system to the president, Tom has decided to focus on two processes: production and customer service. Within each process, one activity will be selected for improvement: molding for production and sustaining engineering for customer service. (Sustaining engineers are responsible for redesigning products based on customer needs and feedback.) Value-added standards are identified for each activity. For molding, the value-added standard calls for nine pounds per mold. (Although the products differ in shape and function, their size, as measured by weight, is uniform.) The value-added standard is based on the elimination of all waste due to defective molds (materials is by far the major cost for the molding activity). The standard price for molding is 15 per pound. For sustaining engineering, the standard is 60 percent of current practical activity capacity. This standard is based on the fact that about 40 percent of the complaints have to do with design features that could have been avoided or anticipated by the company. Current practical capacity (the first year) is defined by the following requirements: 18,000 engineering hours for each product group that has been on the market or in development for five years or less, and 7,200 hours per product group of more than five years. Four product groups have less than five years experience, and 10 product groups have more. There are 72 engineers, each paid a salary of 70,000. Each engineer can provide 2,000 hours of service per year. There are no other significant costs for the engineering activity. For the first year, actual pounds used for molding were 25 percent above the level called for by the value-added standard; engineering usage was 138,000 hours. There were 240,000 units of output produced. Tom and the operational managers have selected some improvement measures that promise to reduce non-value-added activity usage by 30 percent in the second year. Selected actual results achieved for the second year are as follows: The actual prices paid per pound and per engineering hour are identical to the standard or budgeted prices. Required: 1. For the first year, calculate the non-value-added usage and costs for molding and sustaining engineering. Also, calculate the cost of unused capacity for the engineering activity. 2. Using the targeted reduction, establish kaizen standards for molding and engineering (for the second year). 3. Using the kaizen standards prepared in Requirement 2, compute the second-year usage variances, expressed in both physical and financial measures, for molding and engineering. (For engineering, explain why it is necessary to compare actual resource usage with the kaizen standard.) Comment on the companys ability to achieve its targeted reductions. In particular, discuss what measures the company must take to capture any realized reductions in resource usage.arrow_forwardThe management of Wheeler Company has decided to develop cost formulas for its major overhead activities. Wheeler uses a highly automated manufacturing process, and power costs are a significant manufacturing cost. Cost analysts have decided that power costs are mixed; thus, they must be broken into their fixed and variable elements so that the cost behavior of the power usage activity can be properly described. Machine hours have been selected as the activity driver for power costs. The following data for the past eight quarters have been collected: Required: 1. Prepare a scattergraph by plotting power costs against machine hours. Does the scatter-graph show a linear relationship between machine hours and power cost? 2. Using the high and low points, compute a power cost formula. 3. Use the method of least squares to compute a power cost formula. Evaluate the coefficient of determination. 4. Rerun the regression and drop the point (20,000; 26,000) as an outlier. Compare the results from this regression to those for the regression in Requirement 3. Which is better?arrow_forward
- Silven Company has identified the following overhead activities, costs, and activity drivers for the coming year: Silven produces two models of cell phones with the following expected activity demands: 1. Determine the total overhead assigned to each product using the four activity drivers. 2. Determine the total overhead assigned to each model using the two most expensive activities. The costs of the two relatively inexpensive activities are allocated to the two expensive activities in proportion to their costs. 3. Using ABC as the benchmark, calculate the percentage error and comment on the accuracy of the reduced system. Explain why this approach may be desirable.arrow_forwardJohn Thomas, vice president of Mallett Company (a producer of a variety of plastic products), has been supervising the implementation of an ABC management system. John wants to improve process efficiency by improving the activities that define the processes. To illustrate the potential of the new system to the president, John has decided to focus on two processes: production and customer service. Within each process, one activity will be selected for improvement: materials usage for production and sustaining engineering for customer service (sustaining engineers are responsible for redesigning products based on customer needs and feedback). Value-added standards are identified for each activity. For materials usage, the value-added standard calls for six pounds per unit of output (the products differ in shape and function, but their weight is uniform). The value-added standard is based on the elimination of all waste due to defective molds. The standard price of materials is 5 per pound. For sustaining engineering, the standard is 58% of current practical activity capacity. This standard is based on the fact that about 42% of the complaints have to do with design features that could have been avoided or anticipated by the company. Current practical capacity (at the end of 20X1) is defined by the following requirements: 6,000 engineering hours for each product group that has been on the market or in development for 5 years or less and 2,400 hours per product group of more than 5 years. Four product groups have less than 5 years experience, and 10 product groups have more. Each of the 24 engineers is paid a salary of 60,000. Each engineer can provide 2,000 hours of service per year. No other significant costs are incurred for the engineering activity. Actual materials usage for 20X1 was 25% above the level called for by the value-added standard; engineering usage was 46,000 hours. A total of 80,000 units of output were produced. John and the operational managers have selected some improvement measures that promise to reduce nonvalue-added activity usage by 40% in 20X2. Selected actual results achieved for 20X2 are as follows: The actual prices paid for materials and engineering hours are identical to the standard or budgeted prices. Required: 1. For 20X1, calculate the nonvalue-added usage and costs for materials usage and sustaining engineering. 2. CONCEPTUAL CONNECTION Using the budgeted improvements, calculate the expected activity usage levels for 20X2. Now, compute the 20X2 usage variances (the difference between the expected and actual values), expressed in both physical and financial measures, for materials and engineering. Comment on the companys ability to achieve its targeted reductions. In particular, discuss what measures the company must take to capture any realized reductions in resource usage.arrow_forwardJolene Askew, manager of Feagan Company, has committed her company to a strategically sound cost reduction program. Emphasizing life-cycle cost management is a major part of this effort. Jolene is convinced that production costs can be reduced by paying more attention to the relationships between design and manufacturing. Design engineers need to know what causes manufacturing costs. She instructed her controller to develop a manufacturing cost formula for a newly proposed product. Marketing had already projected sales of 25,000 units for the new product. (The life cycle was estimated to be 18 months. The company expected to have 50 percent of the market and priced its product to achieve this goal.) The projected selling price was 20 per unit. The following cost formula was developed: Y=200,000+10X1 where X1=Machinehours(Theproductisexpectedtouseonemachinehourforeveryunitproduced.) Upon seeing the cost formula, Jolene quickly calculated the projected gross profit to be 50,000. This produced a gross profit of 2 per unit, well below the targeted gross profit of 4 per unit. Jolene then sent a memo to the Engineering Department, instructing them to search for a new design that would lower the costs of production by at least 50,000 so that the target profit could be met. Within two days, the Engineering Department proposed a new design that would reduce unit-variable cost from 10 per machine hour to 8 per machine hour (Design Z). The chief engineer, upon reviewing the design, questioned the validity of the controllers cost formula. He suggested a more careful assessment of the proposed designs effect on activities other than machining. Based on this suggestion, the following revised cost formula was developed. This cost formula reflected the cost relationships of the most recent design (Design Z). Y=140,000+8X1+5,000X2+2,000X3 where X1=MachinehoursX2=NumberofbatchesX3=Numberofengineeringchangeorders Based on scheduling and inventory considerations, the product would be produced in batches of 1,000; thus, 25 batches would be needed over the products life cycle. Furthermore, based on past experience, the product would likely generate about 20 engineering change orders. This new insight into the linkage of the product with its underlying activities led to a different design (Design W). This second design also lowered the unit-level cost by 2 per unit but decreased the number of design support requirements from 20 orders to 10 orders. Attention was also given to the setup activity, and the design engineer assigned to the product created a design that reduced setup time and lowered variable setup costs from 5,000 to 3,000 per setup. Furthermore, Design W also creates excess activity capacity for the setup activity, and resource spending for setup activity capacity can be decreased by 40,000, reducing the fixed cost component in the equation by this amount. Design W was recommended and accepted. As prototypes of the design were tested, an additional benefit emerged. Based on test results, the post-purchase costs dropped from an estimated 0.70 per unit sold to 0.40 per unit sold. Using this information, the Marketing Department revised the projected market share upward from 50 percent to 60 percent (with no price decrease). Required: 1. Calculate the expected gross profit per unit for Design Z using the controllers original cost formula. According to this outcome, does Design Z reach the targeted unit profit? Repeat, using the engineers revised cost formula. Explain why Design Z failed to meet the targeted profit. What does this say about the use of unit-based costing for life-cycle cost management? 2. Calculate the expected profit per unit using Design W. Comment on the value of activity information for life-cycle cost management. 3. The benefit of the post-purchase cost reduction of Design W was discovered in testing. What direct benefit did it create for Feagan Company (in dollars)? Reducing post-purchase costs was not a specific design objective. Should it have been? Are there any other design objectives that should have been considered?arrow_forward
- Joseph Fox, controller of Thorpe Company, has been in charge of a project to install an activity-based cost management system. This new system is designed to support the companys efforts to become more competitive. For the past six weeks, he and the project committee members have been identifying and defining activities, associating workers with activities, and assessing the time and resources consumed by individual activities. Now, he and the project committee are focusing on three additional implementation issues: (1) identifying activity drivers, (2) assessing value content, and (3) identifying cost drivers (root causes). Joseph has assigned a committee member the responsibilities of assessing the value content of five activities, choosing a suitable activity driver for each activity, and identifying the possible root causes of the activities. Following are the five activities with possible activity drivers: The committee member ran a regression analysis for each potential activity driver, using the method of least squares to estimate the variable and fixed cost components. In all five cases, costs were highly correlated with the potential drivers. Thus, all drivers appeared to be good candidates for assigning costs to products. The company plans to reward production managers for reducing product costs. Required: 1. What is the difference between an activity driver and a cost driver? In answering the question, describe the purpose of each type of driver. 2. For each activity, assess the value content and classify each activity as value-added or non-value-added (justify the classification). Identify some possible root causes of each activity, and describe how this knowledge can be used to improve activity performance. For purposes of discussion, assume that the value-added activities are not performed with perfect efficiency. 3. Describe the behavior that each activity driver will encourage, and evaluate the suitability of that behavior for the companys objective of becoming more competitive.arrow_forwardEvans, Inc., has a unit-based costing system. Evanss Miami plant produces 10 different electronic products. The demand for each product is about the same. Although they differ in complexity, each product uses about the same labor time and materials. The plant has used direct labor hours for years to assign overhead to products. To help design engineers understand the assumed cost relationships, the Cost Accounting Department developed the following cost equation. (The equation describes the relationship between total manufacturing costs and direct labor hours; the equation is supported by a coefficient of determination of 60 percent.) Y=5,000,000+30X,whereX=directlaborhours The variable rate of 30 is broken down as follows: Because of competitive pressures, product engineering was given the charge to redesign products to reduce the total cost of manufacturing. Using the above cost relationships, product engineering adopted the strategy of redesigning to reduce direct labor content. As each design was completed, an engineering change order was cut, triggering a series of events such as design approval, vendor selection, bill of materials update, redrawing of schematic, test runs, changes in setup procedures, development of new inspection procedures, and so on. After one year of design changes, the normal volume of direct labor was reduced from 250,000 hours to 200,000 hours, with the same number of products being produced. Although each product differs in its labor content, the redesign efforts reduced the labor content for all products. On average, the labor content per unit of product dropped from 1.25 hours per unit to one hour per unit. Fixed overhead, however, increased from 5,000,000 to 6,600,000 per year. Suppose that a consultant was hired to explain the increase in fixed overhead costs. The consultants study revealed that the 30 per hour rate captured the unit-level variable costs; however, the cost behavior of other activities was quite different. For example, setting up equipment is a step-fixed cost, where each step is 2,000 setup hours, costing 90,000. The study also revealed that the cost of receiving goods is a function of the number of different components. This activity has a variable cost of 2,000 per component type and a fixed cost that follows a step-cost pattern. The step is defined by 20 components with a cost of 50,000 per step. Assume also that the consultant indicated that the design adopted by the engineers increased the demand for setups from 20,000 setup hours to 40,000 setup hours and the number of different components from 100 to 250. The demand for other non-unit-level activities remained unchanged. The consultant also recommended that management take a look at a rejected design for its products. This rejected design increased direct labor content from 250,000 hours to 260,000 hours, decreased the demand for setups from 20,000 hours to 10,000 hours, and decreased the demand for purchasing from 100 component types to 75 component types, while the demand for all other activities remained unchanged. Required: 1. Using normal volume, compute the manufacturing cost per labor hour before the year of design changes. What is the cost per unit of an average product? 2. Using normal volume after the one year of design changes, compute the manufacturing cost per hour. What is the cost per unit of an average product? 3. Before considering the consultants study, what do you think is the most likely explanation for the failure of the design changes to reduce manufacturing costs? Now use the information from the consultants study to explain the increase in the average cost per unit of product. What changes would you suggest to improve Evanss efforts to reduce costs? 4. Explain why the consultant recommended a second look at a rejected design. Provide computational support. What does this tell you about the strategic importance of cost management?arrow_forwardJazon Manufacturing produces two different models of cameras. One model has an automatic focus, whereas the other requires the user to determine the focus. The two products are produced in batches. Each time a batch is produced, the equipment must be configured (set up) for the specifications of the camera model being produced. The manual-focus camera requires more parts than the automatic-focus model. The manual-focus model is also more labor intensive, requiring much more assembly time but less machine time. Although the manual model is more labor intensive, the machine configuration required for this product is more complex, causing the manual model to consume more of the setup activity resources than the automatic camera. Many, but not all, of the parts for the two cameras are purchased from external suppliers. Because it has more parts, the manual model makes more demands on the purchasing and receiving activities than does the automatic camera. Jazon currently assigns only manufacturing costs to the two products. Overhead costs are collected in one plantwide pool and are assigned to the two products in proportion to the direct labor hours used by each product. All other costs are viewed as period costs. Jazon budgets costs for all departments within the plantboth support departments like maintenance and purchasing and production departments like machining and assembly. Departmental managers are evaluated and rewarded on their ability to control costs. Individual managerial performance is assessed by comparing actual costs with budgeted costs. Required: 1. Is Jazon using a traditional or an activity-based cost management system? Explain. 2. Assume that you want to design a more accurate cost accounting system. What changes would you need to make? Be specific. Explain why the changes you make will improve the accuracy of cost assignments. 3. What changes would need to be made to implement an activity-based operational control system? Explain why you believe the changes will offer improved control.arrow_forward
- Anderson Company has the following departmental manufacturing structure for one of its products: After some study, the production manager of Anderson recommended the following revised cellular manufacturing approach: Required: 1. Calculate the total time it takes to produce a batch of 20 units using Andersons traditional departmental structure. 2. Using cellular manufacturing, how much time is saved producing the same batch of 20 units? Assuming the cell operates continuously, what is the production rate? Which process controls this production rate? 3. What if the processing times of molding, welding, and assembly are all reduced to six minutes each? What is the production rate now, and how long will it take to produce a batch of 20 units?arrow_forwardAbernathy, Inc., produces two different generators and is concerned about their quality. The company has identified the following quality activities and costs associated with the two products: Required: 1. Calculate the quality cost per unit for each product, and break this unit cost into quality cost categories. Which of the two seems to have the lowest quality? 2. How might a manager use the unit quality cost information?arrow_forwardAuflegger, Inc., manufactures a product that experiences the following activities (and times): Required: 1. Compute the MCE for this product. 2. A study lists the following root causes of the inefficiencies: poor quality components from suppliers, lack of skilled workers, and plant layout. Suggest a possible cost reduction strategy, expressed as a series of if-then statements that will reduce MCE and lower costs. Finally, prepare a strategy map that illustrates the causal paths. In preparing the map, use only three perspectives: learning and growth, process, and financial. 3. Is MCE a lag or a lead measure? If and when MCE acts as a lag measure, what lead measures would affect it?arrow_forward
 Cornerstones of Cost Management (Cornerstones Ser...AccountingISBN:9781305970663Author:Don R. Hansen, Maryanne M. MowenPublisher:Cengage Learning
 Excel Applications for Accounting PrinciplesAccountingISBN:9781111581565Author:Gaylord N. SmithPublisher:Cengage Learning
 Principles of Accounting Volume 2AccountingISBN:9781947172609Author:OpenStaxPublisher:OpenStax College
 Managerial AccountingAccountingISBN:9781337912020Author:Carl Warren, Ph.d. Cma William B. TaylerPublisher:South-Western College Pub
 Managerial Accounting: The Cornerstone of Busines...AccountingISBN:9781337115773Author:Maryanne M. Mowen, Don R. Hansen, Dan L. HeitgerPublisher:Cengage Learning