
Concept explainers
Videos
Expand Your Knowledge: Residual Plot The least-squares line usually does not go through all the sample data points (x, y). In fact, for a specified x value from a data pair (x, y), there is usually a difference between the predicted value and the y value paired with x. This difference is called the residual.
The residual is the difference between the y value in a specified data pair (x, y) and the value
One way to assess how well a least-squares line serves as a model for the data is a residual plot. To make a residual plot, we pull the x values in order on the horizontal axis and plot the corresponding residuals
| Residual | |||||||
| X | y |
|
|
||||
| 6 | 15 | 12.6 | 2.4 | ||||
| 20 | 31 | 26.8 | 4.2 | ||||
| 0 | 10 | 6.6 | 3.4 | ||||
| 14 | 16 | 20.7 | -4.7 | ||||
| 25 | 28 | 31.8 | -3.8 | ||||
| Residual | |||||||
| X | y |
|
|
||||
| 16 | 20 | 22.7 | -2.7 | ||||
| 28 | 40 | 34.8 | 5.2 | ||||
| 18 | 25 | 24.7 | 0.3 | ||||
| 10 | 12 | 16.7 | -4.7 | ||||
| 8 | 15 | 14.6 | 0.4 | ||||
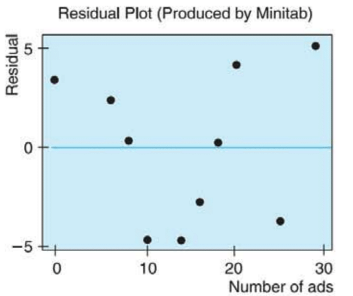
If the least-squares line provides a reasonable model for the data, the pattern of points in the plot will seem random and unstructured about the horizontal line at 0. Is this the case for the residual plot?
If a point on the residual plot seems far outside the pattern of other points, it might reflect an unusual data point (x. y), called an outlier. Such points may have quite an influence on the least-squares model. Do there appear to be any outliers in the data for the residual plot?

Trending nowThis is a popular solution!

Chapter 4 Solutions
Understanding Basic Statistics


- Given n pairs of observations on explained variable Y and explanatory variable X , econometrician chooses sample regression function (SRF) in such a way that the sum of the residuals Σe = Σ (yi – ŷ) is small as possible (a) Explain the problem of adopting criterion of minimizing Σe b) The problem of minimizing sum of the residuals can be avoided by adopting the least squares criterion. Explain the importance of adopting this method.arrow_forwardThe Average final score was 78, the average midterm score was 80. The standard deviation for the average final midterm score was 4.5 and the standard deviation for the average midterm score was 5.5. The correlation coefficient is 0.76 Find the least squares regression line. Supposed that wanted to find to predict the final exam score based the midterm scorearrow_forwardOrdinary Least Squares (OLS) is a regression estimation technique , why it is used for?arrow_forward
- I need to see how to do it using excel spreadsheet , find the linear least squares regression equation let x=time in years since 1900 and y= minimum hourly wage. Use equation to estimate the minimum hourly wage of U.S workers in 2025 show work with calculationsarrow_forwardMany high school students take either the SAT or the ACT. However, some students take both. Data were collected from 100 students who took both college entrance exams. The average SAT score was 920 with a standard deviation of 170. The average ACT score was 20 with a standard deviation of 5. The correlation coefficient r between these two variables equals 0.82. To predict the SAT score from a student’s ACT score, what is the equation of the least-squares regression line? Please show your work.arrow_forwardCreate a multiple regression model with the total number of wins as the response variable, and average points scored, average relative skill, and average points differential as predictor variables. This regression model will help your coach predict how many games your team might win in a regular season based on metrics like the average score, average relative skill, and the average points differential between the team and their opponents. What is the Null Hypothesis (statistical notation and its description in words) Alternative Hypothesis (statistical notation and its description in words)arrow_forward
- In a study of 2000 model cars, a researcher computed the least-squares regression line of price (in collars) on horsepower. He obtained the following equation of this regression line: Price = -7000 + 170 horsepower Based on the least-squares regression line, what would we predict the cost of a 2000 model car with horsepower equal to 230 to be (assuming no extrapolation error). Please show calculations as tutorial on how to answer the question.arrow_forwardWhat is the least squares method and how is it used to find the estimated regression equation? What is the role of least squares method in calculating coefficient of determination?arrow_forwardA group of 13 healthy children and adolescents participated in a phycological study designed to analyze the relationship between age and average total sleep time (ATST). To obtain a measure for ATST (in minutes), recordings were taken on each subject on three consecutive nights and then averaged. Results are provided to you in Sleep&Age.xlsx Download Sleep&Age.xlsx file. (2 points) Determine the least-squares regression line for predicting average total sleep time using age. (2 points) Make a scatter plot of the data with ATST on the y-axis (vertical axis) and Age on the x-axis (horizontal axis) with least squares regression line overlaid on the top (i.e.: obtain the fitted line plot). Make sure to attach the plot below. (7 points) Check the assumptions for the simple linear regression. Attach any plots you used check the assumptions and comment on them. (7 points) We want to see if the average sleep time decreases as the children grow older. Write the appropriate null and…arrow_forward
- compute the least-squares regression line for predicting diatolic pressure (y)from systolic pressure(x) find the P-value Interpret the P-value state a conclusionarrow_forwardb. A best-fit line has been included on the calibration curve via a least squares analysis. By simple visual inspection of the figure to the right (do not re-create it), explicitly write out the equation/model for this calibration curve including units. c. Using your model (i.e. not just visual) from part-b of this question, what would be the analyte concentration when the detector response is 250 mV (show your work)?d. Using your model from part-b and extrapolating, what would be measured detector response when the concentration is 73.7 uM? (show your work)?arrow_forwardIn Austria ,The amount of money spent on the restoration of a sanctuary and the distinct kangaroo populations present appeared to have negative correlations For investigation of this onserved assocaition ,what can a resecher do to begin his research 1Conduct an experiment 2Calculate the squares of coreealtion coefficient 3Calculate the least squares regression line 4 calculate the corelation coefficient Explain answer in 1 or 2 linesarrow_forward
 MATLAB: An Introduction with ApplicationsStatisticsISBN:9781119256830Author:Amos GilatPublisher:John Wiley & Sons Inc
 Probability and Statistics for Engineering and th...StatisticsISBN:9781305251809Author:Jay L. DevorePublisher:Cengage Learning
 Statistics for The Behavioral Sciences (MindTap C...StatisticsISBN:9781305504912Author:Frederick J Gravetter, Larry B. WallnauPublisher:Cengage Learning
 Elementary Statistics: Picturing the World (7th E...StatisticsISBN:9780134683416Author:Ron Larson, Betsy FarberPublisher:PEARSON
 The Basic Practice of StatisticsStatisticsISBN:9781319042578Author:David S. Moore, William I. Notz, Michael A. FlignerPublisher:W. H. Freeman
 Introduction to the Practice of StatisticsStatisticsISBN:9781319013387Author:David S. Moore, George P. McCabe, Bruce A. CraigPublisher:W. H. Freeman