
Essentials Of Business Analytics
1st Edition
ISBN: 9781285187273
Author: Camm, Jeff.
Publisher: Cengage Learning,
expand_more
expand_more
format_list_bulleted
Videos
Textbook Question
Chapter 5, Problem 22P
Consider the following time series:
- a. Construct a time series plot. What type of pattern exists in the data? Is there an indication of a seasonal pattern?
- b. Use a multiple linear regression model with dummy variables as follows to develop an equation to account for seasonal effects in the data: Qtr1 = 1 if quarter 1, 0 otherwise; Qtr2 = 1 if quarter 2, 0 otherwise; Qtr3 = 1 if quarter 3, 0 otherwise.
- c. Compute the quarterly forecasts for next year.
Expert Solution & Answer
Want to see the full answer?
Check out a sample textbook solution
Students have asked these similar questions
Consider the following time series data.
Quarter
Year 1
Year 2
Year 3
1
4
6
7
2
0
1
4
3
3
5
6
4
5
7
8
(a)
Choose the correct time series plot.
(i)
(ii)
(iii)
(iv)
What type of pattern exists in the data?
(b)
Use a multiple regression model with dummy variables as follows to develop an equation to account for seasonal effects in the data: Qtr1 = 1 if Quarter 1, 0 otherwise; Qtr2 = 1 if Quarter 2, 0 otherwise; Qtr3 = 1 if Quarter 3, 0 otherwise.
If required, round your answers to three decimal places. For subtractive or negative numbers use a minus sign even if there is a + sign before the blank (Example: -300). If the constant is "1" it must be entered in the box. Do not round intermediate calculation.
ŷ = + Qtr1 + Qtr2 + Qtr3
(c)
Compute the quarterly forecasts for next year based on the model you developed in part (b).
If required, round your answers to three decimal places. Do not round…
Consider the following time series data.
Quarter Year 1 Year 2 Year 3
1 4 6 7
2 2 3 6
3 3 5 6
4 5 7 8
Choose the correct time series plot.
(i)
(ii)
(iii)
(iv)
- Plot (iii) What type of pattern exists in the data?- Horizontal Pattern with Seasonality
Use a multiple regression model with dummy variables as follows to develop an equation to account for seasonal effects in the data. Qtr1 = 1 if Quarter 1, 0 otherwise; Qtr2 = 1 if Quarter 2, 0 otherwise; Qtr3 = 1 if Quarter 3, 0 otherwise. If required, round your answers to three decimal places. For subtractive or negative numbers use a minus sign even if there is a + sign before the blank. (Example: -300)Value = fill in the blank 3 + fill in the blank 4 Qtr1 + fill in the blank 5 Qtr2 + fill in the blank 6 Qtr3 + fill in the blank 7 t
Compute the quarterly forecasts for next year. If…
Consider the following time series:
Quarter
Year 1
Year 2
Year 3
1
66
63
57
2
48
40
50
3
59
61
54
4
73
76
67
(a)
Choose a time series plot.
(i)
(ii)
(iii)
(iv)
What type of pattern exists in the data? Is there an indication of a seasonal pattern?
(b)
Use a multiple linear regression model with dummy variables as follows to develop an equation to account for seasonal effects in the data: Qtr1 = 1 if quarter 1, 0 otherwise; Qtr2 = 1 if quarter 2, 0 otherwise; Qtr3 = 1 if quarter 3, 0 otherwise. For subtractive or negative numbers use a minus sign even if there is a + sign before the blank (Example: -300).
ŷ = ?? + ?? Qtr1 +?? Qtr2 + ?? Qtr3
(c)
Compute the quarterly forecasts for next year.
Year
Quarter
Ft
4
1
4
2
4
3
4
4
Chapter 5 Solutions
Essentials Of Business Analytics
Ch. 5 - Consider the following time series data:
Using...Ch. 5 - Refer to the time series data in Problem 1. Using...Ch. 5 - Problems 1 and 2 used different forecasting...Ch. 5 - Consider the following time series data:
Compute...Ch. 5 - Consider the following time series...Ch. 5 - Consider the following time series...Ch. 5 - Prob. 8PCh. 5 - Prob. 9PCh. 5 - Prob. 10PCh. 5 - For the Hawkins Company, the monthly percentages...
Ch. 5 - Corporate triple A bond interest rates for 12...Ch. 5 - The values of Alabama building contracts (in...Ch. 5 - The following time series shows the sales of a...Ch. 5 - Prob. 15PCh. 5 - The following table reports the percentage of...Ch. 5 - Consider the following time series: a. Construct a...Ch. 5 - Consider the following time series:
Construct a...Ch. 5 - The Seneca Children’s Fund (SCF) is a local...Ch. 5 - The president of a small manufacturing firm is...Ch. 5 - Consider the following time series: a. Construct a...Ch. 5 - Consider the following time series...Ch. 5 - The quarterly sales data (number of copies sold)...Ch. 5 - Prob. 25PCh. 5 - South Shore Construction builds permanent docks...Ch. 5 - Hogs & Dawgs is an ice cream parlor on the border...Ch. 5 - Donna Nickles manages a gasoline station on the...Ch. 5 - The Vintage Restaurant, on Captiva Island near...
Knowledge Booster


Learn more about
Need a deep-dive on the concept behind this application? Look no further. Learn more about this topic, statistics and related others by exploring similar questions and additional content below.Similar questions
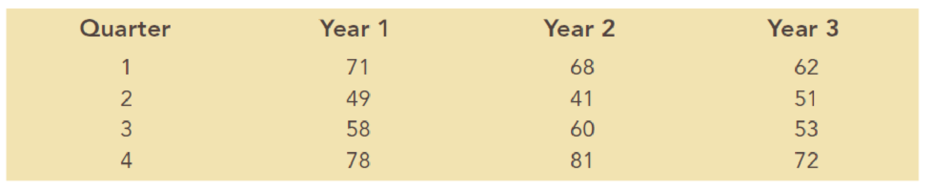
- Olympic Pole Vault The graph in Figure 7 indicates that in recent years the winning Olympic men’s pole vault height has fallen below the value predicted by the regression line in Example 2. This might have occurred because when the pole vault was a new event there was much room for improvement in vaulters’ performances, whereas now even the best training can produce only incremental advances. Let’s see whether concentrating on more recent results gives a better predictor of future records. (a) Use the data in Table 2 (page 176) to complete the table of winning pole vault heights shown in the margin. (Note that we are using x=0 to correspond to the year 1972, where this restricted data set begins.) (b) Find the regression line for the data in part ‚(a). (c) Plot the data and the regression line on the same axes. Does the regression line seem to provide a good model for the data? (d) What does the regression line predict as the winning pole vault height for the 2012 Olympics? Compare this predicted value to the actual 2012 winning height of 5.97 m, as described on page 177. Has this new regression line provided a better prediction than the line in Example 2?arrow_forwardConsider the following time series. Quarter Year 1 Year 2 Year 3 1 71 68 62 2 49 41 51 3 58 60 53 4 78 81 72 Construct a time series plot. What type of pattern exists in the data? Use a multiple linear regression model with dummy variables as follows to develop an equation to account for seasonal effects in the data. Qtr1=1 if Quarter 1, 0 otherwise; Qtr2=1 if Quarter 2, 0 otherwise; Qtr3=1 if Quarter 3, 0 otherwise. Compute the quarterly forecast for the next year.arrow_forwardWhich of the following time-series forecasting methods would not be used to forecast a time series that exhibits a linear trend with no seasonal or cyclical patterns? a. Dummy variable regression b. Linear trend regression c. Multiplicative Winter's method d. Holt Winter's double exponential smoothing e. Both A and Darrow_forward
- Which of the following time series forecasting methods would not be used to forecast seasonal data?arrow_forwardConsider the following time series data. Quarter Year 1 Year 2 Year 3 1 4 6 7 2 0 1 4 3 3 5 6 4 5 7 8 (b) Use a multiple regression model with dummy variables as follows to develop an equation to account for seasonal effects in the data: Qtr1 = 1 if Quarter 1, 0 otherwise; Qtr2 = 1 if Quarter 2, 0 otherwise; Qtr3 = 1 if Quarter 3, 0 otherwise. If required, round your answers to three decimal places. For subtractive or negative numbers use a minus sign even if there is a + sign before the blank (Example: -300). If the constant is "1" it must be entered in the box. Do not round intermediate calculation. ŷ = + Qtr1 + Qtr2 + Qtr3 (c) Compute the quarterly forecasts for next year based on the model you developed in part (b). If required, round your answers to three decimal places. Do not round intermediate calculation. Year Quarter Ft 4 1 4 2 4 3 4 4 (d) Use a multiple…arrow_forwardConsider the following time series data. Week 1 2 3 4 5 6 Value 18 13 16 11 17 14 Construct a time series plot. What type of pattern exist in the data? Develop a three-week moving average for this time series. Compute MSE and forecast for week 7. Use a = 0.2 to compute the exponential smoothing values for the time series. Compute MSE and forecast for week 7.arrow_forward
- consider the following time series data.Month 1 2 3 4 5 6 7Value 24 13 20 12 19 23 15a. compute MSe using the most recent value as the forecast for the next period. Whatis the forecast for month 8?b. compute MSe using the average of all the data available as the forecast for the nextperiod. What is the forecast for month 8?c. Which method appears to provide the better forecast?arrow_forwardConsider the following time series data. Quarter Year 1 Year 2 Year 3 1 4 6 7 2 2 3 6 3 3 5 6 4 5 7 8 Use a multiple regression model with dummy variables as follows to develop an equation to account for seasonal effects in the data. Qtr1 = 1 if Quarter 1, 0 otherwise; Qtr2 = 1 if Quarter 2, 0 otherwise; Qtr3 = 1 if Quarter 3, 0 otherwise. If required, round your answers to three decimal places. For subtractive or negative numbers use a minus sign even if there is a + sign before the blank. (Example: -300)Value = + Qtr1 + Qtr2 + Qtr3 + t Compute the quarterly forecasts for next year. If required, round your answers to two decimal places.Quarter 1 forecast = Quarter 2 forecast = Quarter 3 forecast = Quarter 4 forecast =arrow_forward1. Consider the following time series: a. Construct a time series plot. What type of pattern exists in the data? b. Use simple linear regression analysis to find the parameters for the line that minimizes MSE for this time series.arrow_forward
- Consider the following time series: a. Construct a time series plot. What type of pattern exists in the data?b. Use simple linear regression analysis to find the parameters for the line that minimizesMSE for this time series.c. What is the forecast for t 5 6?arrow_forwardConsider the following time series data: Quarter Year 1 Year 2 Year 3 1 4 6 7 2 2 3 6 3 3 5 6 4 5 7 8 A. Use a multiple regression model with dummy variables as follows to develop an equation to account for seasonal effects in the data: Q1 if quarter 1, 0 otherwise; Q2 if quarter 2, 0 otherwise; Q3 if quarter 3, 0 otherwise. B. Use a multiple regression model to develop an equation to account for trend and seasonal effects in the data. Use the dummy variables you developed in part (A) to capture seasonal effects and create a variable "Trend" such that T=1 for quarter 1 in year 1, T=2 for quarter 2 in year1,.... T=12 for quarter 4 in year 3.arrow_forwardConsider the following time series data Week 1 2 3 4 5 6 Value 18 13 16 11 17 14 a. Construct a time series plot. What type of pattern exists in the data?b. Develop the three-week moving average forecasts for this time series. compute MSE and a forecast for week 7.c. Use α = .2 to compute the exponential smoothing forecasts for the time series.Compute MSE and a forecast for week 7.d. Compare the three-week moving average approach with the exponentialsmoothing approach using α = .2. Which appears to provide more accurate forecasts based on MSE? explain.e. Use a smoothing constant of α = .4 to compute the exponential smoothing forecasts. does a smoothing constant of .2 or .4 appear to provide more accurate forecasts based on MSE? explain.arrow_forward
arrow_back_ios
SEE MORE QUESTIONS
arrow_forward_ios
Recommended textbooks for you
 College AlgebraAlgebraISBN:9781305115545Author:James Stewart, Lothar Redlin, Saleem WatsonPublisher:Cengage Learning
College Algebra
Algebra
ISBN:9781305115545
Author:James Stewart, Lothar Redlin, Saleem Watson
Publisher:Cengage Learning
Time Series Analysis Theory & Uni-variate Forecasting Techniques; Author: Analytics University;https://www.youtube.com/watch?v=_X5q9FYLGxM;License: Standard YouTube License, CC-BY
Operations management 101: Time-series, forecasting introduction; Author: Brandoz Foltz;https://www.youtube.com/watch?v=EaqZP36ool8;License: Standard YouTube License, CC-BY