
Essentials Of Business Analytics
1st Edition
ISBN: 9781285187273
Author: Camm, Jeff.
Publisher: Cengage Learning,
expand_more
expand_more
format_list_bulleted
Videos
Textbook Question
Chapter 5, Problem 6P
Consider the following time series data:
- a. Construct a time series plot. What type of pattern exists in the data?
- b. Develop a three-week moving average for this time series. Compute MSE and a forecast for week 8.
- c. Use α = 0.2 to compute the exponential smoothing values for the time series. Compute MSE and a forecast for week 8.
- d. Compare the three-week moving average forecast with the exponential smoothing forecast using α = 0.2. Which appears to provide the better forecast based on MSE?
- e. Use trial and error to find a value of the exponential smoothing coefficient α that results in a smaller MSE than what you calculated for α = 0.2.
Expert Solution & Answer
Want to see the full answer?
Check out a sample textbook solution
Students have asked these similar questions
Which of the following time series forecasting methods would not be used to forecast seasonal data?
Consider the following time series data.
Week
1
2
3
4
5
6
Value
18
13
16
11
17
14
Construct a time series plot. What type of pattern exist in the data?
Develop a three-week moving average for this time series. Compute MSE and forecast for week 7.
Use a = 0.2 to compute the exponential smoothing values for the time series. Compute MSE and forecast for week 7.
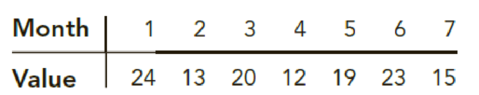
consider the following time series data.Month 1 2 3 4 5 6 7Value 24 13 20 12 19 23 15a. compute MSe using the most recent value as the forecast for the next period. Whatis the forecast for month 8?b. compute MSe using the average of all the data available as the forecast for the nextperiod. What is the forecast for month 8?c. Which method appears to provide the better forecast?
Chapter 5 Solutions
Essentials Of Business Analytics
Ch. 5 - Consider the following time series data:
Using...Ch. 5 - Refer to the time series data in Problem 1. Using...Ch. 5 - Problems 1 and 2 used different forecasting...Ch. 5 - Consider the following time series data:
Compute...Ch. 5 - Consider the following time series...Ch. 5 - Consider the following time series...Ch. 5 - Prob. 8PCh. 5 - Prob. 9PCh. 5 - Prob. 10PCh. 5 - For the Hawkins Company, the monthly percentages...
Ch. 5 - Corporate triple A bond interest rates for 12...Ch. 5 - The values of Alabama building contracts (in...Ch. 5 - The following time series shows the sales of a...Ch. 5 - Prob. 15PCh. 5 - The following table reports the percentage of...Ch. 5 - Consider the following time series: a. Construct a...Ch. 5 - Consider the following time series:
Construct a...Ch. 5 - The Seneca Children’s Fund (SCF) is a local...Ch. 5 - The president of a small manufacturing firm is...Ch. 5 - Consider the following time series: a. Construct a...Ch. 5 - Consider the following time series...Ch. 5 - The quarterly sales data (number of copies sold)...Ch. 5 - Prob. 25PCh. 5 - South Shore Construction builds permanent docks...Ch. 5 - Hogs & Dawgs is an ice cream parlor on the border...Ch. 5 - Donna Nickles manages a gasoline station on the...Ch. 5 - The Vintage Restaurant, on Captiva Island near...
Knowledge Booster


Learn more about
Need a deep-dive on the concept behind this application? Look no further. Learn more about this topic, statistics and related others by exploring similar questions and additional content below.Similar questions
- Consider the following time series data: 1 2 3 4 5 6 7 26 15 22 14 21 25 17 PART 1.Compute MSE using the most recent value as the forecast for the next period and then calculate the forecast for month 8. PART 2.Compute MSE using the average of all the data available as the forecast for the next period. What is the forecast for month 8?arrow_forwardConsider the following time series data Week 1 2 3 4 5 6 Value 18 13 16 11 17 14 a. Construct a time series plot. What type of pattern exists in the data?b. Develop the three-week moving average forecasts for this time series. compute MSE and a forecast for week 7.c. Use α = .2 to compute the exponential smoothing forecasts for the time series.Compute MSE and a forecast for week 7.d. Compare the three-week moving average approach with the exponentialsmoothing approach using α = .2. Which appears to provide more accurate forecasts based on MSE? explain.e. Use a smoothing constant of α = .4 to compute the exponential smoothing forecasts. does a smoothing constant of .2 or .4 appear to provide more accurate forecasts based on MSE? explain.arrow_forwardThe following data set provides the total number of shipments of core major household appliances in the U.S. from 2000 to 2016 (in millions): Year Shipments (millions) 2000 38.4 2001 38.2 2002 40.8 2003 42.5 2004 46.1 2005 47.0 2006 46.7 2007 44.1 2008 39.8 2009 36.5 2010 38.2 2011 36.0 2012 35.8 2013 39.2 2014 41.5 2015 42.9 2016 44.7 a. Plot the time series. b. Fit a three-year moving average to the data and plot the results. c. Fit a five-year moving average to the data and plot the results. d. Compute a linear trend forecasting equation and plot the trend line. e. Compute a quadratic trend forecasting equation and plot the results.arrow_forward
- Consider the following time series data. Week 1 2 3 4 5 6 Value 18 13 16 11 17 14 a. Construct a time series plot. What type of pattern exists in thedata?b. Develop the three-week moving average forecasts for this timeseries. compute MSE and a forecast for week 7.c. Use α= .2 to compute the exponential smoothing forecasts for the time series. Compute MSE and a forecast for week 7.d. Compare the three-week moving average approach with theexponential smoothing approach using α = .2. Which appears to provide more accurate forecasts based on MSE? explain.e. Use a smoothing constant of α = .4 to compute the exponentialsmoothing forecasts. does a smoothing constant of .2 or .4 appearto provide more accurate forecasts based on MSE? explain.arrow_forwardConsider the following time series data Month 1 2 3 4 5 6 7 8 9 10 11 12 Value 80 82 84 83 83 84 85 84 82 83 84 83 a) Construct a time series plot in Excel. Label the axes and graph. b) Develop a three month moving average forecast. Compute MSE and a forecast for month 13. c) Develop an exponential smoothing forecast with a = 0.35. Compute MSE and a forecast for month 13.arrow_forwardWhich of the time series forecasting methods would not be used to forecast seasonal data?arrow_forward
- Consider the following time series data Month 1 2 3 4 5 6 7 8 9 10 11 12 Value 90 89 86 91 90 91 88 86 91 93 90 88 a) Construct a time series plot in Excel. Label the axes and graph. c) Develop a smoothing model forecast with α = 0.35. Compute MSE and forecast for month 13 d) Which model is the better predictor? Why?arrow_forwardConsider the following time series data Month 1 2 3 4 5 6 7 8 9 10 11 12 Value 90 89 86 91 90 91 88 86 91 93 90 88 a) Construct a time series plot in Excel. Label the axes and graph. b) Develop a five month moving average forecast. Compute MSE and a forecast for month 13. c) Develop a smoothing model forecast with α = 0.35. Compute MSE and forecast for month 13 d) Which model is the better predictor? Why?arrow_forward1. Consider the following time series: a. Construct a time series plot. What type of pattern exists in the data? b. Use simple linear regression analysis to find the parameters for the line that minimizes MSE for this time series.arrow_forward
- consider the following time series data.Month 1 2 3 4 5 6 7Value 24 13 20 12 19 23 15construct a time series plot. What type of pattern exists in the data?a. develop the three-week moving average forecasts for this time series. compute MSeand a forecast for week 8.b. Use a = .2 to compute the exponential smoothing forecasts for the time series. compute MSe and a forecast for week 8.c. compare the three-week moving average approach with the exponential smoothing approach using a = .2. Which appears to provide more accurate forecasts based on MSe?d. Use a smoothing constant of a = .4 to compute the exponential smoothing forecasts.does a smoothing constant of .2 or .4 appear to provide more accurate forecasts basedon MSe? explainarrow_forwardConsider the following time series data: Month 1 2 3 4 5 6 7 Value 24 12 20 11 19 24 16 (a) Compute MSE using the most recent value as the forecast for the next period. If required, round your answer to one decimal place. What is the forecast for month 8? If required, round your answer to one decimal place. Do not round intermediate calculation. (b) Compute MSE using the average of all the data available as the forecast for the next period. If required, round your answer to one decimal place. Do not round intermediate calculation. What is the forecast for month 8? If required, round your answer to one decimal place. (c) Which method appears to provide the better forecast? All Data average or Naiivearrow_forwardGiven the number of incidents between 1 to 7 October 2021 in the table below: Date Incidents 1/10/2021 99430 2/10/2021 101786 3/10/2021 103843 4/10/2021 106318 5/10/2021 109804 6/10/2021 113381 7/10/2021 116864 Calculate the MAPE only for these 7 days and compare the forecasting accuracy of the model for this period with its fitting accuracy during the observation period.arrow_forward
arrow_back_ios
SEE MORE QUESTIONS
arrow_forward_ios
Recommended textbooks for you
 MATLAB: An Introduction with ApplicationsStatisticsISBN:9781119256830Author:Amos GilatPublisher:John Wiley & Sons Inc
 Probability and Statistics for Engineering and th...StatisticsISBN:9781305251809Author:Jay L. DevorePublisher:Cengage Learning
 Statistics for The Behavioral Sciences (MindTap C...StatisticsISBN:9781305504912Author:Frederick J Gravetter, Larry B. WallnauPublisher:Cengage Learning
 Elementary Statistics: Picturing the World (7th E...StatisticsISBN:9780134683416Author:Ron Larson, Betsy FarberPublisher:PEARSON
 The Basic Practice of StatisticsStatisticsISBN:9781319042578Author:David S. Moore, William I. Notz, Michael A. FlignerPublisher:W. H. Freeman
 Introduction to the Practice of StatisticsStatisticsISBN:9781319013387Author:David S. Moore, George P. McCabe, Bruce A. CraigPublisher:W. H. Freeman
MATLAB: An Introduction with Applications
Statistics
ISBN:9781119256830
Author:Amos Gilat
Publisher:John Wiley & Sons Inc
Probability and Statistics for Engineering and th...
Statistics
ISBN:9781305251809
Author:Jay L. Devore
Publisher:Cengage Learning
Statistics for The Behavioral Sciences (MindTap C...
Statistics
ISBN:9781305504912
Author:Frederick J Gravetter, Larry B. Wallnau
Publisher:Cengage Learning
Elementary Statistics: Picturing the World (7th E...
Statistics
ISBN:9780134683416
Author:Ron Larson, Betsy Farber
Publisher:PEARSON
The Basic Practice of Statistics
Statistics
ISBN:9781319042578
Author:David S. Moore, William I. Notz, Michael A. Fligner
Publisher:W. H. Freeman
Introduction to the Practice of Statistics
Statistics
ISBN:9781319013387
Author:David S. Moore, George P. McCabe, Bruce A. Craig
Publisher:W. H. Freeman
Time Series Analysis Theory & Uni-variate Forecasting Techniques; Author: Analytics University;https://www.youtube.com/watch?v=_X5q9FYLGxM;License: Standard YouTube License, CC-BY
Operations management 101: Time-series, forecasting introduction; Author: Brandoz Foltz;https://www.youtube.com/watch?v=EaqZP36ool8;License: Standard YouTube License, CC-BY