
Essentials Of Business Analytics
1st Edition
ISBN: 9781285187273
Author: Camm, Jeff.
Publisher: Cengage Learning,
expand_more
expand_more
format_list_bulleted
Videos
Textbook Question
Chapter 5, Problem 20P
The Seneca Children’s Fund (SCF) is a local charity that runs a summer camp for disadvantaged children. The fund’s board of directors has been working very hard over recent years to decrease the amount of overhead expenses, a major factor in how charities are rated by independent agencies. The following data show the percentage of the money SCF has raised that was spent on administrative and fund-raising expenses over the past seven years:
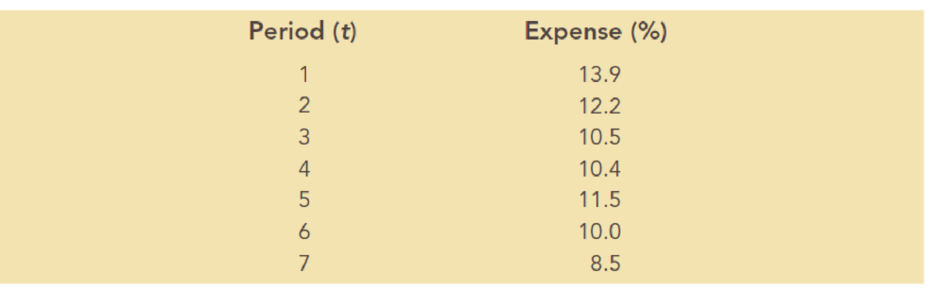
- a. Construct a time series plot. What type of pattern exists in the data?
- b. Use simple linear
regression analysis to find the parameters for the line that minimizes MSE for this time series. - c. Forecast the percentage of administrative expenses for year 8.
- d. If SCF can maintain its current trend in reducing administrative expenses, how long will it take SCF to achieve a level of 5% or less?
Expert Solution & Answer
Want to see the full answer?
Check out a sample textbook solution
Students have asked these similar questions
the values of alabama building contracts (in $ millions) for a 12-month period follow.240 350 230 260 280 320 220 310 240 310 240 230a. construct a time series plot. What type of pattern exists in the data?
Which of the following time series forecasting methods would not be used to forecast seasonal data?
The report “Daily Cigarette Use: Indicators on Children and Youth" (Child Trends Data Bank, childtrends.org/wp-content/uploads/2012/11/03 _Smoking_new.pdf, retrieved April 17, 2017) included the accompanying data on the percentage of students who report smoking cigarettes daily, for students in grades 8, 10, and 12.
Construct a time series plot for students in grade 12, and comment on any trend over time.
Construct a time series plot that shows trends over time for each of the three grade levels. Graph each of the three-time series on the same set of axes, using different colors to distinguish the different grade levels. Either label the time series in the plot or include a legend to indicate which time series corresponds to which grade level.
Write a paragraph based on the plot from Part (b). Discuss the similarities and differences for the three grade levels
Chapter 5 Solutions
Essentials Of Business Analytics
Ch. 5 - Consider the following time series data:
Using...Ch. 5 - Refer to the time series data in Problem 1. Using...Ch. 5 - Problems 1 and 2 used different forecasting...Ch. 5 - Consider the following time series data:
Compute...Ch. 5 - Consider the following time series...Ch. 5 - Consider the following time series...Ch. 5 - Prob. 8PCh. 5 - Prob. 9PCh. 5 - Prob. 10PCh. 5 - For the Hawkins Company, the monthly percentages...
Ch. 5 - Corporate triple A bond interest rates for 12...Ch. 5 - The values of Alabama building contracts (in...Ch. 5 - The following time series shows the sales of a...Ch. 5 - Prob. 15PCh. 5 - The following table reports the percentage of...Ch. 5 - Consider the following time series: a. Construct a...Ch. 5 - Consider the following time series:
Construct a...Ch. 5 - The Seneca Children’s Fund (SCF) is a local...Ch. 5 - The president of a small manufacturing firm is...Ch. 5 - Consider the following time series: a. Construct a...Ch. 5 - Consider the following time series...Ch. 5 - The quarterly sales data (number of copies sold)...Ch. 5 - Prob. 25PCh. 5 - South Shore Construction builds permanent docks...Ch. 5 - Hogs & Dawgs is an ice cream parlor on the border...Ch. 5 - Donna Nickles manages a gasoline station on the...Ch. 5 - The Vintage Restaurant, on Captiva Island near...
Knowledge Booster


Learn more about
Need a deep-dive on the concept behind this application? Look no further. Learn more about this topic, statistics and related others by exploring similar questions and additional content below.Similar questions
- Give at least three examples from economics where each of the following type of data can be used: cross-sectional data, time series data, and panel data.arrow_forwardThe following data set provides the total number of shipments of core major household appliances in the U.S. from 2000 to 2016 (in millions): Year Shipments (millions) 2000 38.4 2001 38.2 2002 40.8 2003 42.5 2004 46.1 2005 47.0 2006 46.7 2007 44.1 2008 39.8 2009 36.5 2010 38.2 2011 36.0 2012 35.8 2013 39.2 2014 41.5 2015 42.9 2016 44.7 a. Plot the time series. b. Fit a three-year moving average to the data and plot the results. c. Fit a five-year moving average to the data and plot the results. d. Compute a linear trend forecasting equation and plot the trend line. e. Compute a quadratic trend forecasting equation and plot the results.arrow_forwardYear Gross Federal Debt ($millions) 1945 260,123 1950 256,853 1955 274,366 1960 290,525 1965 322,318 1970 380,921 1975 541,925 1980 909,050 1985 1,817,521 1990 3,206,564 1995 4,921,005 2000 5,686,338 Construct a scatter plot with this data. Do you observe a trend? If so, what type of trend do you observe? Use Excel to fit a linear trend and an exponential trend to the data. Display the models and their respective r^2. Interpret both models. Which model seems to be more appropriate? Why?arrow_forward
- The Badrutt’s Palace Hotel St. Moritz which is one of the best Alpine hotels in Switzerland has provided you with their quarterly bookings data over the last 6 years as follows: Year Quarter-1 (Demand in units) Quarter-2 (Demand in units) Quarter-3 (Demand in units) Quarter-4 (Demand in units) 2018 45,000 22,000 64,000 33,000 2019 48,000 27,000 74,000 41,000 2020 52,000 32,000 83,000 46,000 2021 57,000 35,000 94,000 52,000 2022 61,000 42,000 104,000 56,000 2023 67,000 49,000 120,000 61,000 Required: i) Calculate the seasonal indices for each season using multiplicative index ii) Forecast the demand for each season of the year 2024 given that the annual demand forecast is 324,000 units. iii) Deseasonalize the actual demand data (2018-2023) above using the seasonal indices obtained in (a) above. iv) Generate OLS equation using the Deseasonalized data in (iii) above (in thousand units)arrow_forwardA dataset that consists of information from the American Community Survey from years 2006, 2007, and 2008, is an example of which type of data? A) •Time series B) Pooled cross-sectional C) Panel D) Cross-sectionalarrow_forwardToward the middle of the harvesting season, peaches for canning come in three types, early, late, and extra late, depending on the expected date of ripening. During a certain week, the data to the right were recorded at a fruit delivery station. Complete parts (a) through (d) below. 40 trucks went out carrying early peaches; 76 carried late peaches; 64 carried extra late peaches; 31 carried early and late; 34 carried late and extra late; 13 carried early and extra late; 6 carried all three; 8 carried only figs (no peaches at all). a. How many trucks carried only late variety peaches? b. How many carried only extra late? c. How many carried only one type of peach? d. How many trucks (in all) went out during the week? Thank you so mucharrow_forward
- Toward the middle of the harvesting season, peaches for canning come in three types, early, late, and extra late, depending on the expected date of ripening. During a certain week, the data to the right were recorded at a fruit delivery station. Complete parts (a) through (d) below. 40 trucks went out carrying early peaches; 71 carried late peaches; 52 carried extra late peaches; 26 carried early and late; 32 carried late and extra late; 11 carried early and extra late; 6 carried all three; 5 carried only figs (no peaches at all). a) How many trucks carried only late variety peaches? trucks (Type a whole number.) (b) How many carried only extra late? trucks (Type a whole number.) (c) How many carried only one type of peach? trucks (Type a whole number.) (d)How many trucks (in all) went out during the week? trucks (Type a whole number.)arrow_forwardFind out the next month after april income by using the forecasting method of the moving average methodarrow_forwardFor each of the following data sets, construct a scatter plot, draw a line of best fit, use two points to find the equation for the line, and predict the specified future value.arrow_forward
- What would we call March 2020’s data point? What happened at that point in time to cause this? arrow_forwardWhich of the time series forecasting methods would not be used to forecast seasonal data?arrow_forwardConsider the following time seriesweek 1 2 3 4 5 6 value 18 13 16 11 17 14 a) Construct a time series plot? What type of pattern exists in the datab) Develop the three week moving average forecasts for this time series, then compute the measures of forecasts accurecyarrow_forward
arrow_back_ios
SEE MORE QUESTIONS
arrow_forward_ios
Recommended textbooks for you
 MATLAB: An Introduction with ApplicationsStatisticsISBN:9781119256830Author:Amos GilatPublisher:John Wiley & Sons Inc
 Probability and Statistics for Engineering and th...StatisticsISBN:9781305251809Author:Jay L. DevorePublisher:Cengage Learning
 Statistics for The Behavioral Sciences (MindTap C...StatisticsISBN:9781305504912Author:Frederick J Gravetter, Larry B. WallnauPublisher:Cengage Learning
 Elementary Statistics: Picturing the World (7th E...StatisticsISBN:9780134683416Author:Ron Larson, Betsy FarberPublisher:PEARSON
 The Basic Practice of StatisticsStatisticsISBN:9781319042578Author:David S. Moore, William I. Notz, Michael A. FlignerPublisher:W. H. Freeman
 Introduction to the Practice of StatisticsStatisticsISBN:9781319013387Author:David S. Moore, George P. McCabe, Bruce A. CraigPublisher:W. H. Freeman
MATLAB: An Introduction with Applications
Statistics
ISBN:9781119256830
Author:Amos Gilat
Publisher:John Wiley & Sons Inc
Probability and Statistics for Engineering and th...
Statistics
ISBN:9781305251809
Author:Jay L. Devore
Publisher:Cengage Learning
Statistics for The Behavioral Sciences (MindTap C...
Statistics
ISBN:9781305504912
Author:Frederick J Gravetter, Larry B. Wallnau
Publisher:Cengage Learning
Elementary Statistics: Picturing the World (7th E...
Statistics
ISBN:9780134683416
Author:Ron Larson, Betsy Farber
Publisher:PEARSON
The Basic Practice of Statistics
Statistics
ISBN:9781319042578
Author:David S. Moore, William I. Notz, Michael A. Fligner
Publisher:W. H. Freeman
Introduction to the Practice of Statistics
Statistics
ISBN:9781319013387
Author:David S. Moore, George P. McCabe, Bruce A. Craig
Publisher:W. H. Freeman
Time Series Analysis Theory & Uni-variate Forecasting Techniques; Author: Analytics University;https://www.youtube.com/watch?v=_X5q9FYLGxM;License: Standard YouTube License, CC-BY
Operations management 101: Time-series, forecasting introduction; Author: Brandoz Foltz;https://www.youtube.com/watch?v=EaqZP36ool8;License: Standard YouTube License, CC-BY