
Essentials Of Business Analytics
1st Edition
ISBN: 9781285187273
Author: Camm, Jeff.
Publisher: Cengage Learning,
expand_more
expand_more
format_list_bulleted
Videos
Textbook Question
Chapter 5, Problem 23P
Consider the following time series data:
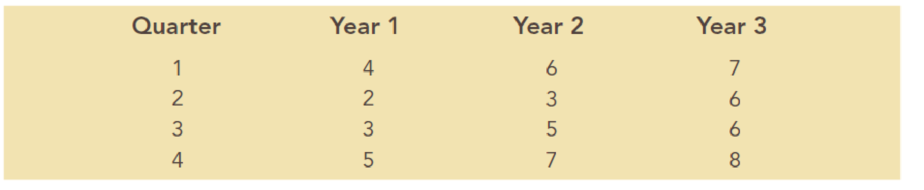
- a. Construct a time series plot. What type of pattern exists in the data?
- b. Use a multiple regression model with dummy variables as follows to develop an equation to account for seasonal effects in the data: Qtr1 = 1 if quarter 1, 0 otherwise; Qtr2 = 1 if quarter 2. 0 otherwise; Qtr3 = 1 if quarter 3, 0 otherwise.
- c. Compute the quarterly forecasts for next year based on the model you developed in part (b).
- d. Use a multiple regression model to develop an equation to account for trend and seasonal effects in the data. Use the dummy variables you developed in part (b) to capture seasonal effects and create a variable t such that t = 1 for quarter 1 in year 1, t = 2 for quarter 2 in year 1, … t = 12 for quarter 4 in year 3.
- e. Compute the quarterly forecasts for next year based on the model you developed in part (d).
- f. Is the model you developed in part (b) or the model you developed in part (d) more effective? Justify your answer.
Expert Solution & Answer

Trending nowThis is a popular solution!

Students have asked these similar questions
Consider the following time series data.
Quarter Year 1 Year 2 Year 3
1 4 6 7
2 2 3 6
3 3 5 6
4 5 7 8
Choose the correct time series plot.
(i)
(ii)
(iii)
(iv)
- Plot (iii) What type of pattern exists in the data?- Horizontal Pattern with Seasonality
Use a multiple regression model with dummy variables as follows to develop an equation to account for seasonal effects in the data. Qtr1 = 1 if Quarter 1, 0 otherwise; Qtr2 = 1 if Quarter 2, 0 otherwise; Qtr3 = 1 if Quarter 3, 0 otherwise. If required, round your answers to three decimal places. For subtractive or negative numbers use a minus sign even if there is a + sign before the blank. (Example: -300)Value = fill in the blank 3 + fill in the blank 4 Qtr1 + fill in the blank 5 Qtr2 + fill in the blank 6 Qtr3 + fill in the blank 7 t
Compute the quarterly forecasts for next year. If…
Consider the following time series data.
Quarter
Year 1
Year 2
Year 3
1
4
6
7
2
0
1
4
3
3
5
6
4
5
7
8
(a)
Choose the correct time series plot.
(i)
(ii)
(iii)
(iv)
What type of pattern exists in the data?
(b)
Use a multiple regression model with dummy variables as follows to develop an equation to account for seasonal effects in the data: Qtr1 = 1 if Quarter 1, 0 otherwise; Qtr2 = 1 if Quarter 2, 0 otherwise; Qtr3 = 1 if Quarter 3, 0 otherwise.
If required, round your answers to three decimal places. For subtractive or negative numbers use a minus sign even if there is a + sign before the blank (Example: -300). If the constant is "1" it must be entered in the box. Do not round intermediate calculation.
ŷ = + Qtr1 + Qtr2 + Qtr3
(c)
Compute the quarterly forecasts for next year based on the model you developed in part (b).
If required, round your answers to three decimal places. Do not round…
Consider the following time series:
Quarter
Year 1
Year 2
Year 3
1
66
63
57
2
48
40
50
3
59
61
54
4
73
76
67
(a)
Choose a time series plot.
(i)
(ii)
(iii)
(iv)
What type of pattern exists in the data? Is there an indication of a seasonal pattern?
(b)
Use a multiple linear regression model with dummy variables as follows to develop an equation to account for seasonal effects in the data: Qtr1 = 1 if quarter 1, 0 otherwise; Qtr2 = 1 if quarter 2, 0 otherwise; Qtr3 = 1 if quarter 3, 0 otherwise. For subtractive or negative numbers use a minus sign even if there is a + sign before the blank (Example: -300).
ŷ = ?? + ?? Qtr1 +?? Qtr2 + ?? Qtr3
(c)
Compute the quarterly forecasts for next year.
Year
Quarter
Ft
4
1
4
2
4
3
4
4
Chapter 5 Solutions
Essentials Of Business Analytics
Ch. 5 - Consider the following time series data:
Using...Ch. 5 - Refer to the time series data in Problem 1. Using...Ch. 5 - Problems 1 and 2 used different forecasting...Ch. 5 - Consider the following time series data:
Compute...Ch. 5 - Consider the following time series...Ch. 5 - Consider the following time series...Ch. 5 - Prob. 8PCh. 5 - Prob. 9PCh. 5 - Prob. 10PCh. 5 - For the Hawkins Company, the monthly percentages...
Ch. 5 - Corporate triple A bond interest rates for 12...Ch. 5 - The values of Alabama building contracts (in...Ch. 5 - The following time series shows the sales of a...Ch. 5 - Prob. 15PCh. 5 - The following table reports the percentage of...Ch. 5 - Consider the following time series: a. Construct a...Ch. 5 - Consider the following time series:
Construct a...Ch. 5 - The Seneca Children’s Fund (SCF) is a local...Ch. 5 - The president of a small manufacturing firm is...Ch. 5 - Consider the following time series: a. Construct a...Ch. 5 - Consider the following time series...Ch. 5 - The quarterly sales data (number of copies sold)...Ch. 5 - Prob. 25PCh. 5 - South Shore Construction builds permanent docks...Ch. 5 - Hogs & Dawgs is an ice cream parlor on the border...Ch. 5 - Donna Nickles manages a gasoline station on the...Ch. 5 - The Vintage Restaurant, on Captiva Island near...
Knowledge Booster


Learn more about
Need a deep-dive on the concept behind this application? Look no further. Learn more about this topic, statistics and related others by exploring similar questions and additional content below.Similar questions
- Which of the following time series forecasting methods would not be used to forecast seasonal data?arrow_forwardWhich of the following time-series forecasting methods would not be used to forecast a time series that exhibits a linear trend with no seasonal or cyclical patterns? a. Dummy variable regression b. Linear trend regression c. Multiplicative Winter's method d. Holt Winter's double exponential smoothing e. Both A and Darrow_forwardConsider the following time series. Quarter Year 1 Year 2 Year 3 1 71 68 62 2 49 41 51 3 58 60 53 4 78 81 72 Construct a time series plot. What type of pattern exists in the data? Use a multiple linear regression model with dummy variables as follows to develop an equation to account for seasonal effects in the data. Qtr1=1 if Quarter 1, 0 otherwise; Qtr2=1 if Quarter 2, 0 otherwise; Qtr3=1 if Quarter 3, 0 otherwise. Compute the quarterly forecast for the next year.arrow_forward
- Consider the following time series data. Week 1 2 3 4 5 6 Value 18 13 16 11 17 14 Construct a time series plot. What type of pattern exist in the data? Develop a three-week moving average for this time series. Compute MSE and forecast for week 7. Use a = 0.2 to compute the exponential smoothing values for the time series. Compute MSE and forecast for week 7.arrow_forwardConsider the following time series data. Quarter Year 1 Year 2 Year 3 1 4 6 7 2 2 3 6 3 3 5 6 4 5 7 8 Use a multiple regression model with dummy variables as follows to develop an equation to account for seasonal effects in the data. Qtr1 = 1 if Quarter 1, 0 otherwise; Qtr2 = 1 if Quarter 2, 0 otherwise; Qtr3 = 1 if Quarter 3, 0 otherwise. If required, round your answers to three decimal places. For subtractive or negative numbers use a minus sign even if there is a + sign before the blank. (Example: -300)Value = + Qtr1 + Qtr2 + Qtr3 + t Compute the quarterly forecasts for next year. If required, round your answers to two decimal places.Quarter 1 forecast = Quarter 2 forecast = Quarter 3 forecast = Quarter 4 forecast =arrow_forwardConsider the following time series data. Quarter Year 1 Year 2 Year 3 1 4 6 7 2 0 1 4 3 3 5 6 4 5 7 8 (b) Use a multiple regression model with dummy variables as follows to develop an equation to account for seasonal effects in the data: Qtr1 = 1 if Quarter 1, 0 otherwise; Qtr2 = 1 if Quarter 2, 0 otherwise; Qtr3 = 1 if Quarter 3, 0 otherwise. If required, round your answers to three decimal places. For subtractive or negative numbers use a minus sign even if there is a + sign before the blank (Example: -300). If the constant is "1" it must be entered in the box. Do not round intermediate calculation. ŷ = + Qtr1 + Qtr2 + Qtr3 (c) Compute the quarterly forecasts for next year based on the model you developed in part (b). If required, round your answers to three decimal places. Do not round intermediate calculation. Year Quarter Ft 4 1 4 2 4 3 4 4 (d) Use a multiple…arrow_forward
- consider the following time series data.Month 1 2 3 4 5 6 7Value 24 13 20 12 19 23 15a. compute MSe using the most recent value as the forecast for the next period. Whatis the forecast for month 8?b. compute MSe using the average of all the data available as the forecast for the nextperiod. What is the forecast for month 8?c. Which method appears to provide the better forecast?arrow_forwardConsider the following time series data: Quarter Year 1 Year 2 Year 3 1 4 6 7 2 2 3 6 3 3 5 6 4 5 7 8 A. Use a multiple regression model with dummy variables as follows to develop an equation to account for seasonal effects in the data: Q1 if quarter 1, 0 otherwise; Q2 if quarter 2, 0 otherwise; Q3 if quarter 3, 0 otherwise. B. Use a multiple regression model to develop an equation to account for trend and seasonal effects in the data. Use the dummy variables you developed in part (A) to capture seasonal effects and create a variable "Trend" such that T=1 for quarter 1 in year 1, T=2 for quarter 2 in year1,.... T=12 for quarter 4 in year 3.arrow_forwardMovieflix, an online movie streaming service that offers a wide variety of award-winning TV shows, movies, animes, and documentaries, would like to determine the mathematical trend of memberships in order to project future needs.Year 2013 2014 2015 2016 2017 2018 2019 2020 2021Membership (000s)17 16 16 21 20 20 23 25 24 (i) Use the following time series data, to develop a regression equation relating memberships to time.arrow_forward
- Consider the following time series data Week 1 2 3 4 5 6 Value 18 13 16 11 17 14 a. Construct a time series plot. What type of pattern exists in the data?b. Develop the three-week moving average forecasts for this time series. compute MSE and a forecast for week 7.c. Use α = .2 to compute the exponential smoothing forecasts for the time series.Compute MSE and a forecast for week 7.d. Compare the three-week moving average approach with the exponentialsmoothing approach using α = .2. Which appears to provide more accurate forecasts based on MSE? explain.e. Use a smoothing constant of α = .4 to compute the exponential smoothing forecasts. does a smoothing constant of .2 or .4 appear to provide more accurate forecasts based on MSE? explain.arrow_forwardConsider the following time series.t 1 2 3 4 5 6 7 Yt 120 110 100 96 94 92 88a. What type of pattern exists in the data?HorizontalSeasonal with upward trendDownward trendUpward trendSeasonal with downward trendb. Regression analysis yields the following forecast equation: 119.71 - 4.929t; what is the forecast for period 8? Round to the nearest hundredth.c. Regression analysis yields the following forecast equation: 119.71 - 4.929t; what is the MSE for this forecast method? Round to the nearest hundredth.arrow_forwardConsider the following time series data. Please refer to picture. Use a multiple regression model with dummy variables as follows to develop an equation to account for seasonal effects in the data. Qtr1 = 1 if Quarter 1, 0 otherwise; Qtr2 = 1 if Quarter 2, 0 otherwise; Qtr3 = 1 if Quarter 3, 0 otherwise. If required, round your answers to three decimal places. For subtractive or negative numbers use a minus sign even if there is a + sign before the blank. (Example: -300)Value = __________ + ____________ Qtr1 + ____________ Qtr2 + ___________ Qtr3 +______________ tCompute the quarterly forecasts for next year. If required, round your answers to two decimal places.Quarter 1 forecast = Quarter 2 forecast = Quarter 3 forecast = Quarter 4 forecast =arrow_forward
arrow_back_ios
SEE MORE QUESTIONS
arrow_forward_ios
Recommended textbooks for you
 MATLAB: An Introduction with ApplicationsStatisticsISBN:9781119256830Author:Amos GilatPublisher:John Wiley & Sons Inc
 Probability and Statistics for Engineering and th...StatisticsISBN:9781305251809Author:Jay L. DevorePublisher:Cengage Learning
 Statistics for The Behavioral Sciences (MindTap C...StatisticsISBN:9781305504912Author:Frederick J Gravetter, Larry B. WallnauPublisher:Cengage Learning
 Elementary Statistics: Picturing the World (7th E...StatisticsISBN:9780134683416Author:Ron Larson, Betsy FarberPublisher:PEARSON
 The Basic Practice of StatisticsStatisticsISBN:9781319042578Author:David S. Moore, William I. Notz, Michael A. FlignerPublisher:W. H. Freeman
 Introduction to the Practice of StatisticsStatisticsISBN:9781319013387Author:David S. Moore, George P. McCabe, Bruce A. CraigPublisher:W. H. Freeman
MATLAB: An Introduction with Applications
Statistics
ISBN:9781119256830
Author:Amos Gilat
Publisher:John Wiley & Sons Inc
Probability and Statistics for Engineering and th...
Statistics
ISBN:9781305251809
Author:Jay L. Devore
Publisher:Cengage Learning
Statistics for The Behavioral Sciences (MindTap C...
Statistics
ISBN:9781305504912
Author:Frederick J Gravetter, Larry B. Wallnau
Publisher:Cengage Learning
Elementary Statistics: Picturing the World (7th E...
Statistics
ISBN:9780134683416
Author:Ron Larson, Betsy Farber
Publisher:PEARSON
The Basic Practice of Statistics
Statistics
ISBN:9781319042578
Author:David S. Moore, William I. Notz, Michael A. Fligner
Publisher:W. H. Freeman
Introduction to the Practice of Statistics
Statistics
ISBN:9781319013387
Author:David S. Moore, George P. McCabe, Bruce A. Craig
Publisher:W. H. Freeman
Time Series Analysis Theory & Uni-variate Forecasting Techniques; Author: Analytics University;https://www.youtube.com/watch?v=_X5q9FYLGxM;License: Standard YouTube License, CC-BY
Operations management 101: Time-series, forecasting introduction; Author: Brandoz Foltz;https://www.youtube.com/watch?v=EaqZP36ool8;License: Standard YouTube License, CC-BY