
ACCESS IN BB-ACC202
null Edition
ISBN: 9780135375587
Author: Pearson
Publisher: PEARSON
expand_more
expand_more
format_list_bulleted
Videos
Textbook Question
Chapter 6, Problem 6.52BE
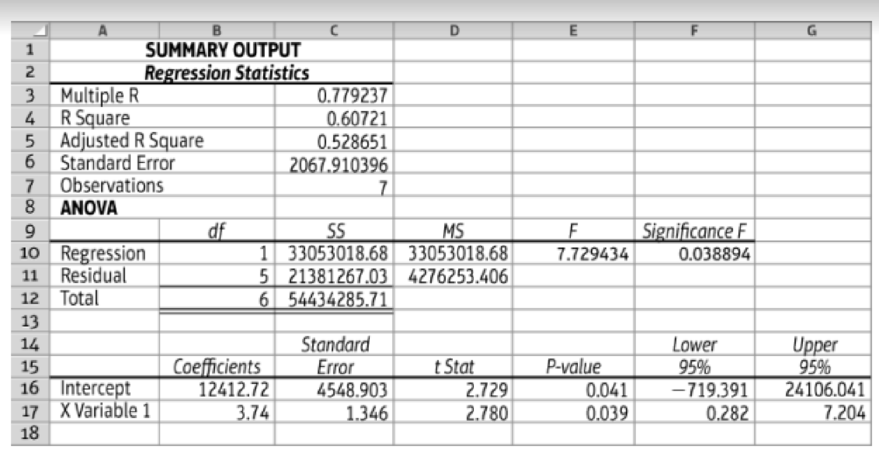
Using regression analysis output to predict overhead for a hospital laboratory (Learning Objective 5)
Using the data provided in E6-50B, the laboratory manager performed a regression analysis to predict total laboratory overhead costs. The output generated by Excel is as follows:
Requirements
- 1. Determine the lab’s cost equation (use the output from the Excel regression).
- 2. Determine the R-square (use the output from the Excel regression).
- 3. Predict the total laboratory overhead for the month if 2,700 tests are performed.
Expert Solution & Answer
Want to see the full answer?
Check out a sample textbook solution
Students have asked these similar questions
Click to watch the Tell Me More Learning Objective 4 video and then answer the questions below.
1. Which of the following represents the computation of direct materials cost per equivalent unit?
Total direct cost for the period divided by total equivalent units of direct materials.
Total equivalent units of direct materials divided by total direct cost for the period.
Total direct cost for the period divided by total units of direct materials.
Total units of direct materials divided by total direct cost for the period.
2. What is the conversion cost per equivalent unit, when the total conversion cost for the period is $1,225 and the total units of packaged drinking water produced during the same period is 5,000 gallons (70 percent complete).
$0.17 per gallon
$0.35 per gallon
$2.86 per gallon
None of these choices are correct.
Classify costs and make a quality-initiative decision (Learning Objective 5) Sinclair Corp. manufactures radiation-shielding glass panels . Suppose Sinclair is consider-ing spending the following amounts on a new TOM program :Strength-testing one item from each batch of panels ......................... . Training employees in TOM ................................................................. . Training suppliers in TOM .................................................................... . Identifying preferred suppliers that commit to on-time delivery ofperfect quality materials ................................................................... .Sinclair expects the new program to save costs through the following:Avoid lost profits from lost sales due to disappointed customers ....... Avoid rework and spoilage ................................................................. .. Avoid inspection of raw materials ........................................................ . Avoid…
Calculate a job cost using ABC (Learning Objective 2)Oliver Industries, a small, family-run manufacturer, has adopted an ABC system . The fol- lowing manufacturing activities, indirect manufacturing costs, and usage of cost drivers have been estimated for the year :54-7Direct materials ................................................................................ ? Direct labor ...................................................................................... ? Manufacturing overhead ...... .......... .......... ............. ................. .......... ? Total job cost .................................................................................... $?Classifying costs within the cost hierarchy (Learning Objective 2) Classify each of the following costs as either unit-level, batch-level, product-level, orfacility-level.a. Engineering costs for new productb. Order processingc. Depreciation on factoryd. Direct labore. Shipment of an order to a customerf. Product line manager…
Chapter 6 Solutions
ACCESS IN BB-ACC202
Ch. 6 - (Learning Objective 1) A graph of a variable cost...Ch. 6 - (Learning Objective 2) Which of the following is...Ch. 6 - (Learning Objective 2) In the cost equation...Ch. 6 - Prob. 4QCCh. 6 - Prob. 5QCCh. 6 - (Learning Objective 3) Which of the following is...Ch. 6 - Prob. 7QCCh. 6 - (Learning Objective 5) Which of the following is...Ch. 6 - Prob. 9QCCh. 6 - Prob. 10QC
Ch. 6 - Identify cost behavior (Learning Objectives 1 2)...Ch. 6 - Prob. 6.2SECh. 6 - Compute fixed costs per unit (Learning Objective...Ch. 6 - Prob. 6.4SECh. 6 - Predict and graph total mixed costs (Learning...Ch. 6 - Prob. 6.6SECh. 6 - Prepare and analyze a scatterplot (Learning...Ch. 6 - Prob. 6.8SECh. 6 - Use the high-low method (Learning Objective 4)...Ch. 6 - Prob. 6.10SECh. 6 - Prob. 6.11SECh. 6 - Prob. 6.12SECh. 6 - Write a cost equation given regression output...Ch. 6 - Prepare a contribution margin income statement...Ch. 6 - Prepare income statements using variable costing...Ch. 6 - Prepare income statements using variable costing...Ch. 6 - Identify cost behavior graph (Learning Objectives...Ch. 6 - Prob. 6.18SECh. 6 - Prob. 6.19SECh. 6 - Prob. 6.20AECh. 6 - Prepare income statement in two formats (Learning...Ch. 6 - Prob. 6.22AECh. 6 - Prob. 6.23AECh. 6 - Sustainability and cost estimation (Learning...Ch. 6 - Create a scatterplot (Learning Objective 3) Melody...Ch. 6 - Continuation of E6-25A: High-low method (Learning...Ch. 6 - Continuation of E6-25A: Regression analysis...Ch. 6 - Regression analysis using Excel output (Learning...Ch. 6 - Prob. 6.29AECh. 6 - Using the high-low method to predict overhead for...Ch. 6 - Using regression analysis output to predict...Ch. 6 - Performing a regression analysis to predict...Ch. 6 - Prob. 6.33AECh. 6 - Prob. 6.34AECh. 6 - Compare absorption and variable costing (Learning...Ch. 6 - Prepare a contribution margin income statement...Ch. 6 - Prepare a contribution margin income statement...Ch. 6 - Prepare income statements using variable costing...Ch. 6 - Prepare a variable costing income statement given...Ch. 6 - Prob. 6.40AECh. 6 - Prob. 6.41BECh. 6 - Prepare income statement in two formats (Learning...Ch. 6 - Use unit cost data to forecast total costs...Ch. 6 - Prob. 6.44BECh. 6 - Sustainability and cost estimation (Learning...Ch. 6 - Create a scatter plot (Learning Objective 3) Tammy...Ch. 6 - Continuation of E6-46B: High-low method (Learning...Ch. 6 - Prob. 6.48BECh. 6 - Prob. 6.49BECh. 6 - Prob. 6.50BECh. 6 - Using the high-low method to predict overhead for...Ch. 6 - Using regression analysis output to predict...Ch. 6 - Prob. 6.53BECh. 6 - Prob. 6.54BECh. 6 - Prob. 6.55BECh. 6 - Prob. 6.56BECh. 6 - Prob. 6.57BECh. 6 - Prob. 6.58BECh. 6 - Prob. 6.59BECh. 6 - Prepare a variable costing income statement given...Ch. 6 - Prob. 6.61BECh. 6 - Analyze cost behavior at a hospital using various...Ch. 6 - Analyze cost behavior (Learning Objectives 1, 2,...Ch. 6 - Prob. 6.64APCh. 6 - Prob. 6.65APCh. 6 - Prob. 6.66APCh. 6 - Analyze cost behavior at a hospital using various...Ch. 6 - Analyze cost behavior (Learning Objectives 1, 2,...Ch. 6 - Prepare traditional and contribution margin income...Ch. 6 - Prob. 6.70BPCh. 6 - Prob. 6.71BPCh. 6 - Prob. 6.72SCCh. 6 - Cost Behavior in Real Companies Choose a company...Ch. 6 - Ethics of building inventory (Learning Objective...Ch. 6 - Prob. 6.76ACT
Knowledge Booster


Learn more about
Need a deep-dive on the concept behind this application? Look no further. Learn more about this topic, accounting and related others by exploring similar questions and additional content below.Similar questions
- A marketing professor at Givens College is interested in the relationship between hours spent studying and total points earned in a course. Data collected on 156 students who took the course last semester are provided in the tile MktHrsPts. Develop a scatter chart for these data. What does the scatter chart indicate about the relationship between total points earned and hours spent studying? Develop an estimated regression equation showing how total points earned is related to hours spent studying. What is the estimated regression model? Test whether each of the regression parameters β0 and β1 is equal to zero at a 0.01 level of significance. What are the correct interpretations of the estimated regression parameters? Are these interpretations reasonable? How much of the variation in the sample values of total point earned does the model you estimated in part (b) explain? Mark Sweeney spent 95 hours studying. Use the regression model you estimated in part (b) to predict the total points Mark earned.arrow_forwardI have the following information: direct materials $250 and total manufacturing cost $700. Overhead applied to jobs at a rate of 200% of direct labor cost. This is for Chapter 2 job costing in managerial accounting. I am supposed to figure out conversion cost, direct labor cost, and manufacturing overhead. I know the formula for conversion cost= direct labor + manufacturing OH Prime cost= direct labor + direct materials How do I figure out direct labor cost with the given information? The learning objective states calcualte predetermined overhead rate, but I do not have estimated manufacturing cost and estimated labor. Can you please help? Thanks, Erica Gordonarrow_forwardMANAGEMENT ACCOUNTING & CONTROL STANDARD COSTS AND VARIANCE ANALYSIS LEARNING ACTIVITY 1 Torres Company has established standard costs for the cabinet department, in which one size of MX cabinet is made. The standard costs of producing one of these MX cabinets are shown below: Standard Cost Card – MX Cabinet Direct Material: Lumber 50 board ft at P 4 200 Direct Labor: 8 hours at P 10 80 Overhead Costs: Variable – 8 hrs at P5 40 Fixed – 8 hrs at P3 24 Total Standard Unit Cost 344 During June 2018, 500 of these cabinets were produced. The cost of operations during the month are shown below. There is no work in process at the beginning and end of the month. Direct material purchased: 30,000 bf at P4.10 123,000 Direct materials used: 24,000 board ft Direct labor: 4,200 hrs at P9.50 39,900 Overhead Costs : Variable Costs 22,000 Fixed Costs 11,000…arrow_forward
- Click to watch the Tell Me More Learning Objective 2 video and then answer the questions below. 1. The first step in preparing a cost of production report is to _____. compute equivalent units of production determine the units to be assigned costs determine the cost per equivalent unit allocate costs to units transferred out and partially completed units 2. The last step in preparing a cost of production report is to _____. compute equivalent units of production determine the units to be assigned costs determine the cost per equivalent unit allocate costs to units transferred out and partially completed unitsarrow_forwardAverage labor cost for the first 700 units of a product is RO 50 and the average labor cost of first 1400 units is RO 45. Average time per unit is 100 minutes. The learning ratio and the average labour cost for first 2800 units will be: a. 80% and RO 36.000 b. 90% and RO 40.500 c. 85% and RO 38.250 d. 95% and RO 42.750arrow_forwardWeber Valley Regional Hospital has collected data on all of its activities for the past 16 months. Data for cardiac nursing care follow: Required: 1. Using the high-low method, calculate the variable rate per hour and the fixed cost for the nursing care activity. 2. Run a regression on the data, using hours of nursing care as the independent variable. Predict cost for the cardiac nursing care for September Year 2 if 1,400 hours of nursing care are forecast. Evaluate the regression equation. How comfortable are you with the predicted cost for September Year 2? 3. Upon looking into the events that happened at the end of Year 1, you find that the cardiology ward bought a cardiac-monitoring machine for the nursing station. Administrators also decided to add a new supervisory position for the evening shift. Monthly depreciation on the monitor and the salary of the new supervisor together total 10,000. Now, run two regression equations, one for the observations from Year 1 and the second using only the observations for the eight months in Year 2. Discuss your findings. What is your predicted cost of the cardiac nursing care activity for September Year 2?arrow_forward
- Assume that Whee, Cheatham, and Howe is an auditing firm that has found that its summer interns are subject to a 90 percent learning curve for one of its important tasks, proofreading financial statements. For one of its interns, Kim Down, the firm has started to analyze the relation between time and financial statement proofreading. Financial StatementsProofread (X) Time Required to Proofreadthe Xth Financial Statement 1 2.0 hours 2 1.8 hours 4 ? 8 ? 16 ? Required: a. Compute the time required to proofread 4, 8, and 16 financial statements.arrow_forwardThe Bienestar Cardiology Clinic has two major activities: diagnostic and treatment. The two activities use four resources: nursing, medical technicians, cardiologists, and equipment. Detailed interviews have provided the work distribution matrix shown below. The total time estimated corresponds to practical capacity (interviewers adjusted the total time to about 80 percent of the available time). The equipment time is measured in machine hours. Thus, the total time (at practical capacity) in the system is 20,000 hours. In considering the implementation of a TDABC model, the following unit times and transaction information are also provided: Required: 1. Calculate the cost of each activity using the indicated values of the resource drivers. 2. Calculate the capacity cost rate for TDABC. Using the capacity cost rate, calculate the cost of each activity under TDABC. Compare these values with those obtained in Requirement 1 and discuss possible reasons for any differences. 3. Suppose that the actual activity driver quantities are 3,500 and 9,000. Calculate the cost of unused capacity. 4. Suppose that the clinic acquires new equipment that reduces the total time required for the two activities from 6,000 to 4,000 hours. The equipment cost remains the same. Explain how the ABC system would be updated and then describe how TDABC would provide updates. 5. Suppose that diagnosing patients without any cardiac disease takes two hours while diagnosing patients with mildly diseased hearts takes an additional 1.5 hours and those with more severe problems takes an additional two hours. Prepare a time equation and, using the capacity cost rate from Requirement 2, calculate the activity rate for each of the three types of patients.arrow_forwardVariable costing income statement for a service companyThe actual and planned data for Underwater University for the Fall termwere as follows: EnrollmentTuition per credit hourCredit hoursRegistration, records, and marketing cost per enrolled studentInstructional costs per credit hourDepreciation on classrooms and equipment 4,500$12060,450$275 $64$825,600 4,125$13543,200$275 $60$825,600 Registration, records, and marketing costs vary by the number ofenrolled students, while instructional costs vary by the number of credithours. Depreciation is a fixed cost. A. Prepare a variable costing income statement showing thecontribution margin and operating income for the Fall term.B. Prepare a contribution margin analysis report comparingplanned with actual performance for the Fall term.arrow_forward
- Click to watch the Tell Me More Learning Objective 1 video and then answer the questions below. 1. Which of the following manufacturers is most likely to use a process cost system? Purse manufacturer Sports drink manufacturer Automobile manufacturer Guitar manufacturer 2. Process and job order cost systems are similar in that both systems _______. record and summarize product costs classify product costs as direct materials, direct labor, and factory overhead allocate factory overhead costs to products All of these choices are correct.arrow_forwardYour company has received an order for 20 units of aproduct. Th e labor cost to produce the item is $9.50 per hour. Th esetup cost for the item is $60 and material costs are $25 per unit. Th e item is sold for $92. Th e learning rate is 80 percent. Overheadis assessed at a rate of 55 percent of unit labor cost.(a) Determine the average unit cost for the 20 units if the fi rstunit takes four hours.(b) Determine the minimum number of units that need to bemade before the selling price meets or exceeds the averageunit cost.arrow_forwardPerformance Aid, Inc. has two divisions: Test Preparation and Language Arts. Results (in millions) for the past three years are partially displayed here: Q.Complete the table by filling in the blanks.arrow_forward
arrow_back_ios
SEE MORE QUESTIONS
arrow_forward_ios
Recommended textbooks for you
 Essentials of Business Analytics (MindTap Course ...StatisticsISBN:9781305627734Author:Jeffrey D. Camm, James J. Cochran, Michael J. Fry, Jeffrey W. Ohlmann, David R. AndersonPublisher:Cengage Learning
 Cornerstones of Cost Management (Cornerstones Ser...AccountingISBN:9781305970663Author:Don R. Hansen, Maryanne M. MowenPublisher:Cengage Learning
 Managerial AccountingAccountingISBN:9781337912020Author:Carl Warren, Ph.d. Cma William B. TaylerPublisher:South-Western College Pub
 Financial And Managerial AccountingAccountingISBN:9781337902663Author:WARREN, Carl S.Publisher:Cengage Learning,
Essentials of Business Analytics (MindTap Course ...
Statistics
ISBN:9781305627734
Author:Jeffrey D. Camm, James J. Cochran, Michael J. Fry, Jeffrey W. Ohlmann, David R. Anderson
Publisher:Cengage Learning
Cornerstones of Cost Management (Cornerstones Ser...
Accounting
ISBN:9781305970663
Author:Don R. Hansen, Maryanne M. Mowen
Publisher:Cengage Learning
Managerial Accounting
Accounting
ISBN:9781337912020
Author:Carl Warren, Ph.d. Cma William B. Tayler
Publisher:South-Western College Pub
Financial And Managerial Accounting
Accounting
ISBN:9781337902663
Author:WARREN, Carl S.
Publisher:Cengage Learning,
GE McKinsey Matrix for SBU Strategies; Author: Wolters World;https://www.youtube.com/watch?v=FffD1Ze76JQ;License: Standard Youtube License