
ACCESS IN BB-ACC202
null Edition
ISBN: 9780135375587
Author: Pearson
Publisher: PEARSON
expand_more
expand_more
format_list_bulleted
Videos
Textbook Question
Chapter 6, Problem 6.28AE
Regression analysis using Excel output (Learning Objective 5)
Assume that Broadway Floral does a regression analysis on the next year’s data using Excel. The output generated by Excel is as follows:
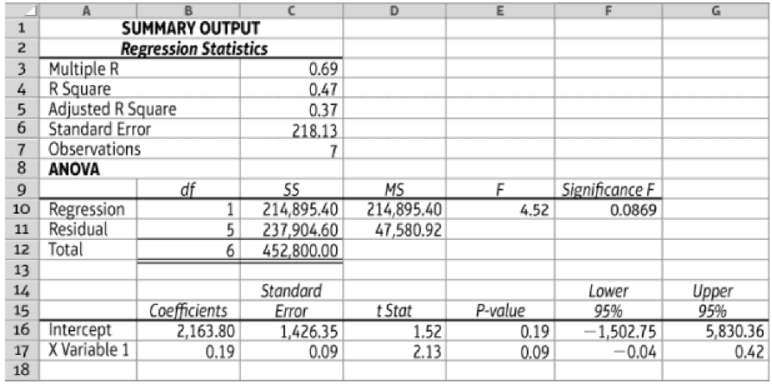
6.2-66 Full Alternative Text
Requirements
- 1. Determine the firm’s cost equation (use the output from the Excel regression).
- 2. Determine the R-square (use the output from the Excel regression). What does Broadway Floral’s R-square indicate?
- 3. Predict van operating costs at a volume of 16,000 miles assuming the company would use the cost equation from the Excel regression regardless of its R-square. Should the company rely on this cost estimate? Why or why not?
Expert Solution & Answer
Want to see the full answer?
Check out a sample textbook solution
Students have asked these similar questions
Classify costs and make a quality-initiative decision (Learning Objective 5) Sinclair Corp. manufactures radiation-shielding glass panels . Suppose Sinclair is consider-ing spending the following amounts on a new TOM program :Strength-testing one item from each batch of panels ......................... . Training employees in TOM ................................................................. . Training suppliers in TOM .................................................................... . Identifying preferred suppliers that commit to on-time delivery ofperfect quality materials ................................................................... .Sinclair expects the new program to save costs through the following:Avoid lost profits from lost sales due to disappointed customers ....... Avoid rework and spoilage ................................................................. .. Avoid inspection of raw materials ........................................................ . Avoid…
Please review the rubric prior to beginning the assignment to become familiar with the expectations for successful completion.You are required to submit this assignment to LopesWrite. Please refer to the directions in the Student Success Center.Paul Duncan, financial manager of EduSoft Inc., is facing a dilemma. The firm was founded 5 years ago to provide educational software for the rapidly expanding primary and secondary school markets. Although EduSoft has done well, the firm's founder believes an industry shakeout is imminent. To survive, EduSoft must grab market share now, and this will require a large infusion of new capital.Because he expects earnings to continue rising sharply and looks for the stock price to follow suit, Mr. Duncan does not think it would be wise to issue new common stock at this time. On the other hand, interest rates are currently high by historical standards, and the firm's B rating means that interest payments on a new debt issue would be prohibitive.…
Learning curve, cumulative average-time learning model. Northern Defense manufactures radar systems. It has just completed the manufacture of its first newly designed system, RS-32. Manufacturing data for the RS-32 follow:
Calculate the total variable costs of producing 2, 4, and 8 units.
Chapter 6 Solutions
ACCESS IN BB-ACC202
Ch. 6 - (Learning Objective 1) A graph of a variable cost...Ch. 6 - (Learning Objective 2) Which of the following is...Ch. 6 - (Learning Objective 2) In the cost equation...Ch. 6 - Prob. 4QCCh. 6 - Prob. 5QCCh. 6 - (Learning Objective 3) Which of the following is...Ch. 6 - Prob. 7QCCh. 6 - (Learning Objective 5) Which of the following is...Ch. 6 - Prob. 9QCCh. 6 - Prob. 10QC
Ch. 6 - Identify cost behavior (Learning Objectives 1 2)...Ch. 6 - Prob. 6.2SECh. 6 - Compute fixed costs per unit (Learning Objective...Ch. 6 - Prob. 6.4SECh. 6 - Predict and graph total mixed costs (Learning...Ch. 6 - Prob. 6.6SECh. 6 - Prepare and analyze a scatterplot (Learning...Ch. 6 - Prob. 6.8SECh. 6 - Use the high-low method (Learning Objective 4)...Ch. 6 - Prob. 6.10SECh. 6 - Prob. 6.11SECh. 6 - Prob. 6.12SECh. 6 - Write a cost equation given regression output...Ch. 6 - Prepare a contribution margin income statement...Ch. 6 - Prepare income statements using variable costing...Ch. 6 - Prepare income statements using variable costing...Ch. 6 - Identify cost behavior graph (Learning Objectives...Ch. 6 - Prob. 6.18SECh. 6 - Prob. 6.19SECh. 6 - Prob. 6.20AECh. 6 - Prepare income statement in two formats (Learning...Ch. 6 - Prob. 6.22AECh. 6 - Prob. 6.23AECh. 6 - Sustainability and cost estimation (Learning...Ch. 6 - Create a scatterplot (Learning Objective 3) Melody...Ch. 6 - Continuation of E6-25A: High-low method (Learning...Ch. 6 - Continuation of E6-25A: Regression analysis...Ch. 6 - Regression analysis using Excel output (Learning...Ch. 6 - Prob. 6.29AECh. 6 - Using the high-low method to predict overhead for...Ch. 6 - Using regression analysis output to predict...Ch. 6 - Performing a regression analysis to predict...Ch. 6 - Prob. 6.33AECh. 6 - Prob. 6.34AECh. 6 - Compare absorption and variable costing (Learning...Ch. 6 - Prepare a contribution margin income statement...Ch. 6 - Prepare a contribution margin income statement...Ch. 6 - Prepare income statements using variable costing...Ch. 6 - Prepare a variable costing income statement given...Ch. 6 - Prob. 6.40AECh. 6 - Prob. 6.41BECh. 6 - Prepare income statement in two formats (Learning...Ch. 6 - Use unit cost data to forecast total costs...Ch. 6 - Prob. 6.44BECh. 6 - Sustainability and cost estimation (Learning...Ch. 6 - Create a scatter plot (Learning Objective 3) Tammy...Ch. 6 - Continuation of E6-46B: High-low method (Learning...Ch. 6 - Prob. 6.48BECh. 6 - Prob. 6.49BECh. 6 - Prob. 6.50BECh. 6 - Using the high-low method to predict overhead for...Ch. 6 - Using regression analysis output to predict...Ch. 6 - Prob. 6.53BECh. 6 - Prob. 6.54BECh. 6 - Prob. 6.55BECh. 6 - Prob. 6.56BECh. 6 - Prob. 6.57BECh. 6 - Prob. 6.58BECh. 6 - Prob. 6.59BECh. 6 - Prepare a variable costing income statement given...Ch. 6 - Prob. 6.61BECh. 6 - Analyze cost behavior at a hospital using various...Ch. 6 - Analyze cost behavior (Learning Objectives 1, 2,...Ch. 6 - Prob. 6.64APCh. 6 - Prob. 6.65APCh. 6 - Prob. 6.66APCh. 6 - Analyze cost behavior at a hospital using various...Ch. 6 - Analyze cost behavior (Learning Objectives 1, 2,...Ch. 6 - Prepare traditional and contribution margin income...Ch. 6 - Prob. 6.70BPCh. 6 - Prob. 6.71BPCh. 6 - Prob. 6.72SCCh. 6 - Cost Behavior in Real Companies Choose a company...Ch. 6 - Ethics of building inventory (Learning Objective...Ch. 6 - Prob. 6.76ACT
Knowledge Booster


Learn more about
Need a deep-dive on the concept behind this application? Look no further. Learn more about this topic, accounting and related others by exploring similar questions and additional content below.Similar questions
- A marketing professor at Givens College is interested in the relationship between hours spent studying and total points earned in a course. Data collected on 156 students who took the course last semester are provided in the tile MktHrsPts. Develop a scatter chart for these data. What does the scatter chart indicate about the relationship between total points earned and hours spent studying? Develop an estimated regression equation showing how total points earned is related to hours spent studying. What is the estimated regression model? Test whether each of the regression parameters β0 and β1 is equal to zero at a 0.01 level of significance. What are the correct interpretations of the estimated regression parameters? Are these interpretations reasonable? How much of the variation in the sample values of total point earned does the model you estimated in part (b) explain? Mark Sweeney spent 95 hours studying. Use the regression model you estimated in part (b) to predict the total points Mark earned.arrow_forwardThe following if-then statements were taken from a Balanced Scorecard: a. If employee capabilities increase, then process time decreases. b. If process time decreases, then customer retention will increase. c. If customer retention increases, then market share will increase. d. If market share increases, then revenues will increase. Required: 1. Identify the lead and lag variables, and explain your reasoning. 2. Discuss the implications of Requirement 1 for the financial and learning and growth perspectives. 3. Using the first if-then statement, explain the concept of double-loop feedback.arrow_forwardProfit Planning and Control This case is a manufacturer and could make specialty bikes, ski or outdoor equipment, computers, food like chocolates, saltwater taffy, cookies, or donuts, etc. Create the balance sheet, income statement, and statement of the cash flow from the following information. Use the following information for the learning experiences Sales volume units = 11,000 Sales price/unit = $100 Variable manufacturing costs/unit = $60 Fixed manufacturing costs = $210,000 Fixed sales & administration costs = $190,000 Business income tax rate = 25% Current assets = $250,000 (Cash $50,000, Accounts Receivables $100,000, Inventory $100,000) Fixed assets = $750,000 Current liabilities = $200,000 (Accounts Payable $100,000, Short Term Debt $100,000) Long Term Debt = $300,000 Owners' Equity = $500,000arrow_forward
- A firm has recently added a new product to their offerings. Manufacturing reports that production is going smoothly and factory workers are becoming familiar with the manufacture of this product. All expectations are that the current rate of learning will continue and the manufacture of future units will be more efficient (i.e., take less time). The following shown table shows the results for the first two units produced. The firm has an order for two additional units. Assuming the pattern of learning curve continues (same rate): Solve, a. At what rate is learning occurring? b. How long will it take to produce the fourth unit? c. If the labor rate is $15 per hour, what is the cumulative average labor cost per unit for the first four units produced?arrow_forwardThe following measures belong to one of four perspectives on the balanced scorecard. Identify the perspective appropriate for each measure listed 1 Return on investmenta. financialb. customerc. processd. learning and growth 2 Time to marketa. financialb. customerc. processd. learning and growth 3 Number of new customersa. financialb. customerc. processd. learning and growth 4 Percentage of revenues from new sourcesa. financialb. customerc. processd. learning and growth 5 Quality costsa. financialb. customerc. processd. learning and growth 6 Employee productivitya. financialb. customerc. processd. learning and growtharrow_forwardQUESTION 1 For each of the balanced scorecard targets listed below, identify the matching perspective: Organizational learning and growth, Internal business processes, Customer, Financial. - A. B. C. D. Customer satisfaction survey improves to 4.5/5 - A. B. C. D. Customer retention is held above 70% - A. B. C. D. Customer hold time average below 2 minutes - A. B. C. D. Percentage of on time delivery over 95% - A. B. C. D. Employee turnover of below 20%. - A. B. C. D. Average employee training hours of over 20 per year. - A. B. C. D. Return on investment…arrow_forward
- Assume you are the manager responsible for implementing a new service. The time to perform the service is subject to the learning curve. Would you prefer that the new service have a learning rate of 85 percent or 80 percent? Why?arrow_forward7-23A Compute breakeven and project income (Learning Objectives 1 & 2)Grover’s Steel Parts produces parts for the automobile industry. The company hasmonthly fixed expenses of $630,000 and a contribution margin of 70% of revenues.Requirements1. Compute Grover’s Steel Parts’ monthly breakeven sales in dollars.2. Use the contribution margin ratio to project operating income (or loss) if revenues are$520,000 and if they are $1,010,000.3. Do the results in Requirement 2 make sense given the breakeven sales you computedin Requirement 1? Explain.arrow_forwardList the business, technological, and organizational challenges that were addressed throughout the project to implement a new learning management system, and explain the three-sphere model for systems management in your own words. Do not depend on the examples in the textbook.arrow_forward
- If you are to give your assessment on the value of Artificial Intelligence in business strategy, at what ratio (example: 50% AI, 50% in person) could AI be employed or utilized for online learning? Identify a particular course in your major (Finance) that you think AI will be useful and explain how this will contribute to a better learning experience for students, cost efficiency for students and the school, and safety and human values considerations. Please explain your answer and specify how you will incorporate AI in the course.arrow_forwardIndicate whether the items below are used as key performance indicators for the areas Percent of students belonging to the top 30 percentile in national standards tests *(A) Financial(B) Customer(C) Internal Process(D) Learning and Growth performance.arrow_forwardIndicate whether the items below are used as key performance indicators for the areas Acid test ratio *(A) Financial(B) Customer(C) Internal Process(D) Learning and Growth performance.arrow_forward
arrow_back_ios
SEE MORE QUESTIONS
arrow_forward_ios
Recommended textbooks for you
 Essentials of Business Analytics (MindTap Course ...StatisticsISBN:9781305627734Author:Jeffrey D. Camm, James J. Cochran, Michael J. Fry, Jeffrey W. Ohlmann, David R. AndersonPublisher:Cengage Learning
 Cornerstones of Cost Management (Cornerstones Ser...AccountingISBN:9781305970663Author:Don R. Hansen, Maryanne M. MowenPublisher:Cengage Learning
 Essentials Of Business AnalyticsStatisticsISBN:9781285187273Author:Camm, Jeff.Publisher:Cengage Learning,
Essentials of Business Analytics (MindTap Course ...
Statistics
ISBN:9781305627734
Author:Jeffrey D. Camm, James J. Cochran, Michael J. Fry, Jeffrey W. Ohlmann, David R. Anderson
Publisher:Cengage Learning
Cornerstones of Cost Management (Cornerstones Ser...
Accounting
ISBN:9781305970663
Author:Don R. Hansen, Maryanne M. Mowen
Publisher:Cengage Learning
Essentials Of Business Analytics
Statistics
ISBN:9781285187273
Author:Camm, Jeff.
Publisher:Cengage Learning,
Economic Value Added EVA - ACCA APM Revision Lecture; Author: OpenTuition;https://www.youtube.com/watch?v=_3hpcMFHPIU;License: Standard Youtube License