
Concept explainers
Videos
Least-Squares Regression Method; Scattergraph; Cost Behavior L06−1 1
Professor John Morton bas just been appointed chairperson of the Finance Department at Westland University. In reviewing the departments cost records, Professor Morton has found the following total cost associated with Finance 101 over the last five terms: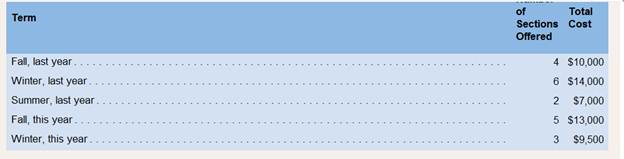
Professor Moron knows that there are some variable costs, such as amounts paid to graduate assistants, associated with the course, He would like to have the variable and fixed costs separated for planning purposes.
Required:
1. Prepare a scattergraph plot. (Plot total cost on the vertical axis and number of sections offered on the horizontal axis.)
2. Using the least-squares regression method, estimate the stable cost per section and the total fixed cost per term for Finance 101. Express these estimates in the form Y= a + bx .
3. Assume that because of the small number of sections offered during the Winter Term this war, Professor Morton will have to offer eight sections of Finance 101 during the Fall Term. Compute the expected total cost for Finance 101. Can you see any problem with using the cost formula from (2) above to derive this total cost figure? Explain.
Want to see the full answer?
Check out a sample textbook solution
Chapter 6 Solutions
Introduction To Managerial Accounting


- Tom uses his computer to calculate the following regression formula:Weekly total costs = $18,791 + ($19.97 * Number of orders per week) Draw the regression line on your graph. Use your graph to evaluate the regression line using the criteria of economic plausibility, goodness of fit, and significance of the independent variable. Is the cost function estimated using the high-low method a close approximation of the cost function estimated using the regression method? Explain briefly.arrow_forwardChoose the correct letter of answer On a scattergrap, the diagonal line cuts across two sets of observations, namely: 600:200, and 900:500 which refer to costs and units, respectively. The fixed costs is plotted in the graph at P400. In this case, the variable cost per unit is equal to: a. P1.00b. P1.25c. P1.50d. P1.12arrow_forwardWhich of the following statements is true regarding regression analysis? Question 8 options: Regression analysis considers all of the data points for determining the line that best fits the data so it is usually less accurate than the high-low method. Regression analysis helps generate a statistic, called the R-square, which tells how well the line fits the data points. Regression analysis can only be used by manufacturing companies to predict costs. All of the above are true.arrow_forward
- AW-analysis of engineering economics problems may be preferred over other methods because: Select one: a. it is easier to budget for b. it is the simplest c. financial institutions require it d. LCM-based analysis period becomes irrelevantarrow_forward16. The following is the simple regression results based on the data from Madrigal Corporation: Dependent variable – Machine maintenance costsIndependent variable – Machine hoursComputed valuesIntercept P 3,500Coefficient on independent variable P 3.50Coefficient of correlation 0.856R2 0.733 What percentage of the variation in maintenance costs is explained by the independent variable?arrow_forwardDetermine if the selection of system 1 or 2 is sensitive to variation in the return required by management. The corporate MARR ranges from 8% to16% per year on different projects. Use tabulated factors or a spreadsheet, as requested by your instructor.arrow_forward
- a) Briefly discuss the similarities and differences between the terms 'overhead absorption rate' and 'cost driver rate'. b) Briefly discuss the meaning of the term 'sensitivity analysis' and how it could be used in variable costing. c) Briefly discuss the characteristics of good information that budgets might be expected to possess. d) Briefly discuss the reasons why payback period is often preferred as an investment appraisal technique, and also its limitations.arrow_forwardIn linear breakeven analysis, if process A has a variable cost of $45 per unit and process B has a variable cost of $31 per unit, which alternative would be preferred if the breakeven point is 7400 units and production is expected to be 6200 units? (a) Process A (b) Process B (c) Process B if its fixed cost is lower than the fixed cost of Process A (d) Cannot tell; need more informationarrow_forwardYou are the new cost accountant for ABX Corporation. After careful review of the company’s operations you have been tasked to determine the company’s break-even point in units and dollars, the numbers sold to meet the company’s target profit and contribution income statement for both outcomes.Management has also asked that you discuss the risk, uncertainty, changing variables and margin of safety regarding Cost Volume Profit Analysis. Based on your discussion and calculations what would be your recommendation if the company wanted to increase variable cost by 20% and sales price by 5%? Support your recommendation. ABX Corporation sold it's product for $600/unit. Fixed cost are $725,000 per year. Variable costs are $455 per unit. ABX Corporation desires a target profit of $1,250,000 per year.arrow_forward
- sing the following data, estimate the new Return on Investment if there is a 6% increase in sales - with average operating assets as the base. Sales $2,640,795 Contribution margin 38% Controllable fixed costs 248,297 Average operating assets $4,486,486 Round to two decimal places. Be sure to enter the answer as a percentage but do not include the % sign. Using the following data, estimate the new Return on Investment if there is a 9% decrease in variable and fixed costs- with average operating assets as the base. Sales $3,023,201 Contribution margin 37% Controllable fixed costs 244,010 Average operating assets $5,136,160 Round to two decimal places. Be sure to enter the answer as a percentage but do not include the % sign.arrow_forward10-19 A regression equation is set up, where the dependent variable is total costs and the independent variable is production. A correlation coefficient of 0.70 implies that: a. The coefficient of determination is negative. b. The level of production explains 49% of the variation in total costs c. There is a slightly inverse relationship between production and total costs. d. A correlation coefficient of 1.30 would produce a regression line with better fit to the dataarrow_forwardThe management of Brinkley Corporation is interested in using simulation to estimate the profit per unit for a new product. The selling price for the product will be $45 per unit. Probability distributions for the purchase cost, the labor cost, and the transportation cost are estimated as follows: ProcurementCost ($) Probability LaborCost ($) Probability TransportationCost ($) Probability 10 0.2 18 0.25 2 0.74 12 0.35 20 0.35 5 0.26 13 0.45 22 0.1 25 0.3 Compute profit per unit for the base-case, worst-case, and best-case scenarios.Profit per unit for the base-case: $ fill in the blank 1Profit per unit for the worst-case: $ fill in the blank 2Profit per unit for the best-case: $ fill in the blank 3 Construct a simulation model to estimate the mean profit per unit. If required, round your answer to the nearest cent.Mean profit per unit = $ fill in the blank 4 Why is the simulation approach to risk analysis preferable to generating a variety of…arrow_forward
 Cornerstones of Cost Management (Cornerstones Ser...AccountingISBN:9781305970663Author:Don R. Hansen, Maryanne M. MowenPublisher:Cengage Learning