
Concept explainers
Videos
(a)
To test: Whether the ‘friends on Facebook’ data is skewed or not by using appropriate graph.
(a)
Answer to Problem 28E
Solution: The data is positively skewed.
Explanation of Solution
Graph: To find whether data is skewed or not, the histogram can be drawn. To draw the histogram, follow the below mentioned steps in Minitab;
Step 1: Enter the data in Minitab and enter variable name as ‘Number of Facebook friend’.
Step 2: Go to
Step 3: In dialog box that appears select ‘friends on Facebook’ under the field marked as ‘Graph variable’. Then click Ok.
The histogram is as follows;
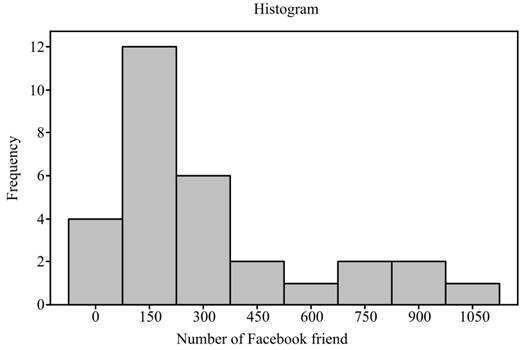
Conclusion: In above graph, it can be seen that most of the frequencies are distributed in right hand side of the highest frequency. Hence, the data is positively skewed.
To explain: The findings.
Answer to Problem 28E
Solution: The
Explanation of Solution
(b)
To explain: Whether t method should be used to calculate 95% confidence interval for mean.
(b)
Answer to Problem 28E
Solution: No, t method should be used to calculate confidence interval.
Explanation of Solution
(c)
Section 1:
To find: The mean number of Facebook friends for sample.
(c)
Section 1:
Answer to Problem 28E
Solution: The sample mean is 305.8 (approximated to 306) friends.
Explanation of Solution
Calculation: To calculate the sample mean follow the below mentioned steps in Minitab;
Step 1: Enter the data in Minitab and enter variable name as ‘Number of Facebook friends’.
Step 2: Go to
Step 3: In dialog box that appears select ‘Number of Facebook friend’ under the field marked as ‘Variables’. Then click on ‘Statistics’.
Step 4: In dialog box that appears select ‘None’ and then ‘Mean’. Finally click ‘Ok’ on both dialog boxes.
From Minitab result, the mean is 305.8 but number of friends is an integer value. So mean can never be a decimal value. Therefore, the nearest integer value will be 306. Hence the mean number of friend will be 306 friends.
Section 2:
To find: The standard deviation of Facebook friends for sample.
Section 2:
Answer to Problem 28E
Solution: The standard deviation is 294.6 (approximated to 295) friends.
Explanation of Solution
Calculation: To calculate the standard deviation follow the below mentioned steps in Minitab;
Step 1: Follow the step 1 to 3 performed in section 1 of part (b).
Step 2: In dialog box that appears select ‘None’ and then ‘standard deviation’. Finally click ‘Ok’ on both dialog boxes.
From Minitab result, the standard deviation is 294.6 friends but number of friends is an integer value. So it can never be a decimal value and the nearest integer value will be 295. Hence the standard deviation of the number of friends will be 295 friends.
Section 3:
To find: The standard error of Facebook friends for sample.
Section 3:
Answer to Problem 28E
Solution: The standard error is 53.8 (approximated to54) friends.
Explanation of Solution
Calculation: To calculate the standard error follow the below mentioned steps in Minitab;
Step 1: Follow the step 1 to 3 performed in section 1 of part (b).
Step 2: In dialog box that appears select ‘None’ and then ‘SE of mean’. Finally, click ‘Ok’ on both dialog boxes.
From Minitab result, the standard error is 53.8 friends but the number of friends is an integer value. So the standard error can never be a decimal value. Therefore, the nearest integer value will be 54. Hence the standard deviation of the number of friends will be 54 friends.
Section 4:
To find: The margin of error for Facebook friends.
Section 4:
Answer to Problem 28E
Solution: The margin of error is 110.005 (approximated to 110) friends.
Explanation of Solution
Calculation: The formula to calculate the margin of error is as follows,
Where
Hence the margin of error is 110.005 friends but the number of friends is an integer value. So the standard error can never be a decimal value. Therefore, the nearest integer value will be 110. Hence the margin of error will be 110 friends.
(d)
To find: 95% confidence interval for data of friends on Facebook.
(d)
Answer to Problem 28E
Solution: The required confidence interval is
Explanation of Solution
Calculation: The confidence interval is an interval for which there is 95% chances that it contains the population parameter (population mean).
To calculate confidence interval, follow the below mentioned steps in Minitab;
Step 1: Enter the provided data into Minitab and enter variable name as ‘Number of Facebook friend’.
Step 2: Go to
Step 3: In the dialog box that appears select ‘Number of Facebook friends’ under the field marked as ‘Sample in columns’. Click on ‘option’.
Step 4: In the dialog box that appears, enter ‘95.0’ under the field marked as ‘Confidence level’ and select ‘not equal’ in ‘Alternative hypothesis’.
From Minitab results 95% confidence interval is (195.8, 415.8). but the number of friends is an integer value. So the limits of confidence interval can never be a decimal value. Hence the nearest integer value will be 196 and 416. Therefore, the confidence interval of the number of friends will be
Want to see more full solutions like this?
Chapter 7 Solutions
Introduction to the Practice of Statistics


 MATLAB: An Introduction with ApplicationsStatisticsISBN:9781119256830Author:Amos GilatPublisher:John Wiley & Sons Inc
 Probability and Statistics for Engineering and th...StatisticsISBN:9781305251809Author:Jay L. DevorePublisher:Cengage Learning
 Statistics for The Behavioral Sciences (MindTap C...StatisticsISBN:9781305504912Author:Frederick J Gravetter, Larry B. WallnauPublisher:Cengage Learning
 Elementary Statistics: Picturing the World (7th E...StatisticsISBN:9780134683416Author:Ron Larson, Betsy FarberPublisher:PEARSON
 The Basic Practice of StatisticsStatisticsISBN:9781319042578Author:David S. Moore, William I. Notz, Michael A. FlignerPublisher:W. H. Freeman
 Introduction to the Practice of StatisticsStatisticsISBN:9781319013387Author:David S. Moore, George P. McCabe, Bruce A. CraigPublisher:W. H. Freeman