
Concept explainers
Videos
(a)
Section1:
To test: The null hypothesis that there is no significant difference in mean between Athletes and Sedentary students for body fat.
(a)
Section1:
Answer to Problem 138E
Solution: The null hypothesis gets rejected. So, there is a significant difference in mean between Athletes and Sedentary students for body fat.
Explanation of Solution
Calculation: The null and alternative hypotheses are:
The t-statistic is used to test the significance of the difference in mean. The pooled standard deviation is used for two standard deviation as
Degree of freedom for the two samples can be calculated by following formula:
Now the t-value can be obtained as follow:
The P-value can be calculated by using the
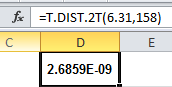
Conclusion: The P-value is less than
Section 2:
To test: The null hypothesis that there is no difference in mean between Athletes and Sedentary students for body mass index.
Section 2:
Answer to Problem 138E
Solution: The null hypothesis gets rejected. So, there is a significant difference in mean between Athletes and Sedentary students for body mass index.
Explanation of Solution
Calculation: The null and alternative hypotheses are:
The t-statistic is used to test the significance of the difference in mean. The pooled standard deviation is used for two standard deviation as
Degree of freedom for the two samples can be calculated by following formula:
The t-value is obtained as follow:
The P-value can be calculated by using the function
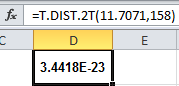
Conclusion: The P-value is less than
Section 3:
To test: The null hypothesis that there is no significant difference in mean between Athletes and Sedentary students for calcium deficit.
Section 3:
Answer to Problem 138E
Solution: The null hypothesis gets rejected. So, there is a difference in mean between Athletes and Sedentary students for calcium deficit.
Explanation of Solution
Calculation: The null and alternative hypotheses are:
The t-statistic is used to test the significance of the difference in mean. The pooled standard deviation is used for two standard deviation as
Degree of freedom for the two samples can be calculated by following formula:
The t-value is obtained as follow:
The P-value can be calculated by using the function
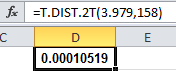
Conclusion: The P-value is less than
Section 4:
To test: The null hypothesis that there is no significant difference in mean between Athletes and Sedentary students for glasses of milk/day.
Section 4:
Answer to Problem 138E
Solution: The null hypothesis does not get rejected. So, there is no difference in mean between Athletes and Sedentary students for glasses of milk/day.
Explanation of Solution
Calculation: The null and alternative hypotheses are:
The t-statistic is used to test the significance of the difference in mean. The pooled standard deviation is used for two standard deviation as
Degree of freedom for the two samples can be calculated by following formula:
The t-value is obtained as follow:
The P-value can be calculated by using the function
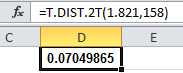
Conclusion: The P-value is greater than 0.05. So, the null hypothesis does not get rejected, which states that there is no significant difference in mean between Athletes and Sedentary students for glasses of milk/day.
(b)
The summary of the hypothesis test results.
(b)
Answer to Problem 138E
Solution: The null hypotheses get rejected for all the characteristic except the Glasses of milk/day.
Explanation of Solution
The P-value are less than
Want to see more full solutions like this?
Chapter 7 Solutions
Introduction to the Practice of Statistics


 MATLAB: An Introduction with ApplicationsStatisticsISBN:9781119256830Author:Amos GilatPublisher:John Wiley & Sons Inc
 Probability and Statistics for Engineering and th...StatisticsISBN:9781305251809Author:Jay L. DevorePublisher:Cengage Learning
 Statistics for The Behavioral Sciences (MindTap C...StatisticsISBN:9781305504912Author:Frederick J Gravetter, Larry B. WallnauPublisher:Cengage Learning
 Elementary Statistics: Picturing the World (7th E...StatisticsISBN:9780134683416Author:Ron Larson, Betsy FarberPublisher:PEARSON
 The Basic Practice of StatisticsStatisticsISBN:9781319042578Author:David S. Moore, William I. Notz, Michael A. FlignerPublisher:W. H. Freeman
 Introduction to the Practice of StatisticsStatisticsISBN:9781319013387Author:David S. Moore, George P. McCabe, Bruce A. CraigPublisher:W. H. Freeman