
Statistics for Engineers and Scientists
4th Edition
ISBN: 9780073401331
Author: William Navidi Prof.
Publisher: McGraw-Hill Education
expand_more
expand_more
format_list_bulleted
Concept explainers
Videos
Textbook Question
Chapter 7.2, Problem 11E
An agricultural scientist planted alfalfa on several plots of land, identical except for the soil pH. Following are the dry matter yields (in pounds per acre) for each plot.
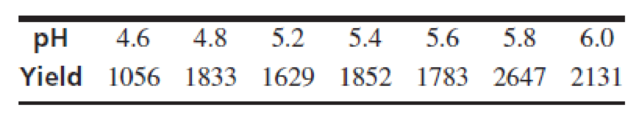
- a. Construct a
scatterplot of yield (y) versus pH (x). Verify that a linear model is appropriate. - b. Compute the least-squares line for predicting yield from pH.
- c. Compute the fitted value and the residual for each point.
- d. If the pH is increased by 0.1, by how much would you predict the yield to increase or decrease?
- e. Predict the yield for a pH of 5.5.
- f. Can the least-squares line be used to predict the yield for a pH of 7? If so, predict the yield. If not, explain why not.
- g. For what pH would you predict a yield of 1500 pounds per acre?
Expert Solution & Answer
Want to see the full answer?
Check out a sample textbook solution
Students have asked these similar questions
Consider the following table containing unemployment rates for a 10-year period.
Unemployment Rates
Year
Unemployment Rate (%)
1
5.85.8
2
3.23.2
3
5.55.5
4
8.68.6
5
6.16.1
6
6.86.8
7
7.57.5
8
5.25.2
9
11.111.1
10
7.47.4
Step 1 of 2 :
Given the model
Estimated Unemployment Rate=β0+β1(Year)+εi,Estimated Unemployment Rate=�0+�1(Year)+��,
write the estimated regression equation using the least squares estimates for β0�0 and β1�1. Round your answers to two decimal places.
Suppose Wesley is a marine biologist who is interested in the relationship between the age and the size of male Dungeness crabs. Wesley collects data on 1,000 crabs and uses the data to develop the following least-squares regression line where ? is the age of the crab in months and ?̂ is the predicted value of ?, the size of the male crab in cm.
?̂=8.2052+0.5693?
What is the value of ?̂ when a male crab is 21.7865 months old? Provide your answer with precision to two decimal place
Suppose Wesley is a marine biologist who is interested in the relationship between the age and the size of male Dungeness crabs. Wesley collects data on 1,000 crabs and uses the data to develop the following least-squares regression line where ? is the age of the crab in months and ?ˆ is the predicted value of ?, the size of the male crab in cm.
?ˆ=8.1312+0.5226?
What is the value of ?ˆ when a male crab is 23.0736 months old? Provide your answer with precision to two decimal places.
?ˆ =
Interpret the value of ?. The value of ?ˆis
the predicted size of a crab when it is 23.0736 months old.
the predicted incremental increase in size for every increase in age by 23.0736 months.
the predicted number of crabs out of the 1,000 crabs collected that will be 23.0736 months old.
the probability that a crab will be 23.0736 months old.
Chapter 7 Solutions
Statistics for Engineers and Scientists
Ch. 7.1 - Compute the correlation coefficient for the...Ch. 7.1 - For each of the following data sets, explain why...Ch. 7.1 - For each of the following scatterplots, state...Ch. 7.1 - True or false, and explain briefly: a. If the...Ch. 7.1 - In a study of ground motion caused by earthquakes,...Ch. 7.1 - A chemical engineer is studying the effect of...Ch. 7.1 - Another chemical engineer is studying the same...Ch. 7.1 - Tire pressure (in kPa) was measured for the right...Ch. 7.1 - Prob. 10ECh. 7.1 - The article Drift in Posturography Systems...
Ch. 7.1 - Prob. 12ECh. 7.1 - Prob. 13ECh. 7.1 - A scatterplot contains four points: (2, 2), (1,...Ch. 7.2 - Each month for several months, the average...Ch. 7.2 - In a study of the relationship between the Brinell...Ch. 7.2 - A least-squares line is fit to a set of points. If...Ch. 7.2 - Prob. 4ECh. 7.2 - In Galtons height data (Figure 7.1, in Section...Ch. 7.2 - In a study relating the degree of warping, in mm....Ch. 7.2 - Moisture content in percent by volume (x) and...Ch. 7.2 - The following table presents shear strengths (in...Ch. 7.2 - Structural engineers use wireless sensor networks...Ch. 7.2 - The article Effect of Environmental Factors on...Ch. 7.2 - An agricultural scientist planted alfalfa on...Ch. 7.2 - Curing times in days (x) and compressive strengths...Ch. 7.2 - Prob. 13ECh. 7.2 - An engineer wants to predict the value for y when...Ch. 7.2 - A simple random sample of 100 men aged 2534...Ch. 7.2 - Prob. 16ECh. 7.3 - A chemical reaction is run 12 times, and the...Ch. 7.3 - Structural engineers use wireless sensor networks...Ch. 7.3 - Prob. 3ECh. 7.3 - Prob. 4ECh. 7.3 - Prob. 5ECh. 7.3 - Prob. 6ECh. 7.3 - The coefficient of absorption (COA) for a clay...Ch. 7.3 - Prob. 8ECh. 7.3 - Prob. 9ECh. 7.3 - Three engineers are independently estimating the...Ch. 7.3 - In the skin permeability example (Example 7.17)...Ch. 7.3 - Prob. 12ECh. 7.3 - In a study of copper bars, the relationship...Ch. 7.3 - Prob. 14ECh. 7.3 - In the following MINITAB output, some of the...Ch. 7.3 - Prob. 16ECh. 7.3 - In order to increase the production of gas wells,...Ch. 7.4 - The following output (from MINITAB) is for the...Ch. 7.4 - The processing of raw coal involves washing, in...Ch. 7.4 - To determine the effect of temperature on the...Ch. 7.4 - The depth of wetting of a soil is the depth to...Ch. 7.4 - Good forecasting and control of preconstruction...Ch. 7.4 - The article Drift in Posturography Systems...Ch. 7.4 - Prob. 7ECh. 7.4 - Prob. 8ECh. 7.4 - A windmill is used to generate direct current....Ch. 7.4 - Two radon detectors were placed in different...Ch. 7.4 - Prob. 11ECh. 7.4 - The article The Selection of Yeast Strains for the...Ch. 7.4 - Prob. 13ECh. 7.4 - The article Characteristics and Trends of River...Ch. 7.4 - Prob. 15ECh. 7.4 - The article Mechanistic-Empirical Design of...Ch. 7.4 - An engineer wants to determine the spring constant...Ch. 7 - The BeerLambert law relates the absorbance A of a...Ch. 7 - Prob. 2SECh. 7 - Prob. 3SECh. 7 - Refer to Exercise 3. a. Plot the residuals versus...Ch. 7 - Prob. 5SECh. 7 - The article Experimental Measurement of Radiative...Ch. 7 - Prob. 7SECh. 7 - Prob. 8SECh. 7 - Prob. 9SECh. 7 - Prob. 10SECh. 7 - The article Estimating Population Abundance in...Ch. 7 - A materials scientist is experimenting with a new...Ch. 7 - Monitoring the yield of a particular chemical...Ch. 7 - Prob. 14SECh. 7 - Refer to Exercise 14. Someone wants to compute a...Ch. 7 - Prob. 16SECh. 7 - Prob. 17SECh. 7 - Prob. 18SECh. 7 - Prob. 19SECh. 7 - Use Equation (7.34) (page 545) to show that 1=1.Ch. 7 - Use Equation (7.35) (page 545) to show that 0=0.Ch. 7 - Prob. 22SECh. 7 - Use Equation (7.35) (page 545) to derive the...
Additional Math Textbook Solutions
Find more solutions based on key concepts
Teacher Salaries
The following data from several years ago represent salaries (in dollars) from a school distri...
Elementary Statistics: A Step By Step Approach
Four different beverages are sold at a fast-food restaurant: soft drinks, tea, coffee, and bottled water. a. Ex...
Basic Business Statistics, Student Value Edition
Ten equally qualified marketing assistants are candidates for promotion to associate buyer; seven are men and t...
An Introduction to Mathematical Statistics and Its Applications (6th Edition)
z Scores. In Exercises 5-8, express all z scores with two decimal places.
8. Plastic Waste Data Set 31 “Garbage...
Elementary Statistics Using Excel (6th Edition)
(a) For each data set, find the mean, median, and mode. (b) Discuss anything about the data that affects the us...
APPLIED STAT.IN BUS.+ECONOMICS
1. How is a sample related to a population?
Elementary Statistics: Picturing the World (6th Edition)
Knowledge Booster


Learn more about
Need a deep-dive on the concept behind this application? Look no further. Learn more about this topic, statistics and related others by exploring similar questions and additional content below.Similar questions
- The basal metabolic rate (kcal/day) of large anteaters is believed to be subject to a power law relationship with its weight (kg). A study was performed measuring several anteaters and reported the following data: Weight (kg) 6.0 28.5 16.0 19.0 23.5 11.0 9.0 25.5 22.0 BMR (kcal/day) 80.1 247.0 162.3 172.4 215.1 111.9 104.6 224.6 208.3 Transform the data correctly to perform a linear least-squares regression, then report your model as y=cxpy=cxp. Estimate the BMR for a 27 kg anteater.arrow_forwardThe operations manager of a musical instrument distributor feels that demand for a particular type of guitar may be related to the number of YouTube views for a music video by the popular rock group Marble Pumpkins during the preceding month. The manager has collected the data shown in the following table: YouTube views (1,000s) Guitar Sales 30 8 40 11 70 12 60 10 80 15 50 13 a. Using the equations presented in this chapter, compute the SST, SSE, and SSR. Find the least-squares regression line for these data (use manual computations) b. Using the regression equation, predict guitar sales if there were 40,000 views last month (use manual computations)arrow_forwardThe following Minitab display gives information regarding the relationship between the body weight of a child (in kilograms) and the metabolic rate of the child (in 100 kcal/ 24 hr). Predictor Coef SE Coef T PConstant 0.8570 0.4148 2.06 0.84Weight 0.38243 0.02978 13.52 0.000 S = 0.517508 R-Sq = 97.4% (a) Write out the least-squares equation. y^= ______ + _____x (b) For each 1 kilogram increase in weight, how much does the metabolic rate of a child increase? (Use 5 decimal places.)arrow_forward
- Suppose Wesley is a marine biologist who is interested in the relationship between the age and the size of male Dungeness crabs. Wesley collects data on 1,000 crabs and uses the data to develop the following least-squares regression line where ?X is the age of the crab in months and ?ˆY^ is the predicted value of ?Y, the size of the male crab in cm. ?ˆ=9.5603+0.3976?Y^=9.5603+0.3976X What is the value of ?ˆY^ when a male crab is 24.9118 months old? Provide your answer with precision to two decimal places. Y=arrow_forwardA security firm wants to renew the uniforms used by his personnel. It starts by collecting data on their height and weight. The following data was collected from the 19 employees Height (cm) Weight (kg) 168 72 175 88 167 84 171 87 161 67 164 55 177 82 170 60 167 60 184 77 183 98 163 53 186 77 165 64 173 89 161 65 179 77 169 64 174 87 a). Construct an equation to relate these variables, using the least-squares method to determine the regression coefficients, b0 and b1. b). Interpret the meaning of b0 and b1 in this problem. c) determine the coefficient of determination, r2 and interpret its meaning.arrow_forwardSuppose a study wants to predict the market price of a certain species of turtle (Y) based on the following independent variables indicated in the table. Based from the table, what is the equation of the multiple linear regression? (Round off up to two decimal places. Market Price = 0.07 - 0.40*weight + 1.51*length + 1.41*width + 0.80*age Market Price = - 0.40*weight + 1.51*length + 1.41*width + 0.80*age Market Price = 0.07 + 0.40*weight + 1.51*length + 1.41*width + 0.80*age Market Price = 0.07 - 0.40 + weight + 1.51 + length + 1.41 + width + 0.80 + agearrow_forward
arrow_back_ios
arrow_forward_ios
Recommended textbooks for you
 Linear Algebra: A Modern IntroductionAlgebraISBN:9781285463247Author:David PoolePublisher:Cengage Learning
Linear Algebra: A Modern Introduction
Algebra
ISBN:9781285463247
Author:David Poole
Publisher:Cengage Learning
Correlation Vs Regression: Difference Between them with definition & Comparison Chart; Author: Key Differences;https://www.youtube.com/watch?v=Ou2QGSJVd0U;License: Standard YouTube License, CC-BY
Correlation and Regression: Concepts with Illustrative examples; Author: LEARN & APPLY : Lean and Six Sigma;https://www.youtube.com/watch?v=xTpHD5WLuoA;License: Standard YouTube License, CC-BY