
Videos
The article “The Selection of Yeast Strains for the Production of Premium Quality South African Brandy Base Products” (C. Steger and M. Lambrechts, Journal of Industrial Microbiology and Biotechnology, 2000:431–440) presents detailed information on the volatile compound composition of base wines made from each of 16 selected yeast strains. Below are the concentrations of total esters and total volatile acids (in mg/L) in each of the wines.
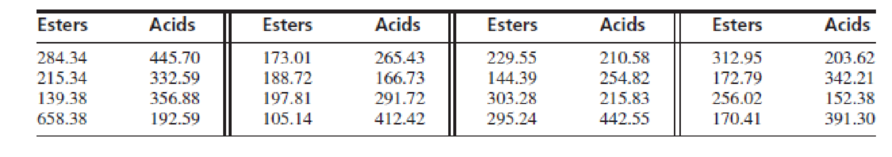
- a. Construct a
scatterplot of acid concentration versus ester concentration. Indicate the outlier. - b. Compute the coefficients of the least-squares line for predicting acid level (y) from ester level (x), along with their estimated standard deviations.
- c. Compute the P-value of the test of the null hypothesis H0 : β1 = 0.
- d. Delete the outlier, and recompute the coefficients of the least-squares line, along with their estimated standard deviations.
- e. Compute the P-value of the test of the null hypothesis H0 : β1 = 0 for the data with the outlier deleted.
- f. Does a linear model appear to be useful for predicting acid concentration from ester concentration? Explain.
Want to see the full answer?
Check out a sample textbook solution
Chapter 7 Solutions
Statistics for Engineers and Scientists
Additional Math Textbook Solutions
Stats: Modeling the World Nasta Edition Grades 9-12
Introduction to Statistical Quality Control
Elementary Statistics Using the TI-83/84 Plus Calculator, Books a la Carte Edition (4th Edition)
Statistics: The Art and Science of Learning from Data (4th Edition)
Introductory Statistics (10th Edition)


- The vulnerability of inshore environments to contamination due to urban and industrial expansion in Mombasa is discussed in the paper “Metals, Petroleum Hydrocarbons and Organo- chlorines in Inshore Sediments and Waters on Mombasa, Kenya” [Marine Pollution Bulletin (1997) 34:570–577]. A geochemical and oceanographic survey of the inshore waters of Mombasa, Kenya, was undertaken during the period from September 1995 to January 1996. In the survey, suspended particulate matter and sediment were collected from 48 stations within Mombasa’s estuarine creeks. The concentrations of major oxides and 13 trace elements were determined for a varying number of cores at each of the stations. In particular, the lead concentrations in sus-pended particulate matter (mg kg21 dry weight) were determined at 37 stations. The researchers were interested in determining whether the average lead concentration was greater than 30 mg kg21 dry weight. The data are given in the following table along with summary…arrow_forwardThe vulnerability of inshore environments to contamination due to urban and industrial expansion in Mombasa is discussed in the paper “Metals, Petroleum Hydrocarbons and Organo- chlorines in Inshore Sediments and Waters on Mombasa, Kenya” [Marine Pollution Bulletin (1997) 34:570–577]. A geochemical and oceanographic survey of the inshore waters of Mombasa, Kenya, was undertaken during the period from September 1995 to January 1996. In the survey, suspended particulate matter and sediment were collected from 48 stations within Mombasa’s estuarine creeks. The concentrations of major oxides and 13 trace elements were determined for a varying number of cores at each of the stations. In particular, the lead concentrations in sus-pended particulate matter (mg kg21 dry weight) were determined at 37 stations. The researchers were interested in determining whether the average lead concentration was greater than 30 mg kg21 dry weight. The data are given in the following table along with summary…arrow_forwardThe vulnerability of inshore environments to contamination due to urban and industrial expansion in Mombasa is discussed in the paper €œMetals, Petroleum Hydrocarbons and Organo-chlorines in Inshore Sediments and Waters on Mombasa, Kenya€ [Marine Pollution Bulletin (1997) 34: 570€“ 577]. A geochemical and oceanographic survey of the inshore waters of Mombasa, Kenya, was undertaken during the period from September 1995 to January 1996. In the survey, suspended particulate matter and sediment were collected from 48 stations within Mombasa€™s estuarine creeks. The concentrations of major oxides and 13 trace elements were determined for a varying number of cores at each of the stations. In particular, the lead concentrations in suspended particulate matter (mg kg-1 dry weight) were determined at 37 stations. The researchers were interested in determining whether the average lead concentration was greater than 30 mg kg-1 dry weight. The data are given in the following table along with…arrow_forward
- PCBs and Pelicans. Polychlorinated biphenyls (PCBs), industrial pollutants, are known to be carcinogens and a great danger to natural ecosystems. As a result of several studies, PCB production was banned in the United States in 1979 and by the Stockholm Convention on Persistent Organic Pollutants in 2001. One study, published in 1972 by R. Risebrough, is titled “Effects of Environmental Pollutants Upon Animals Other Than Man” (Proceedings of the 6th Berkeley Symposium on Mathematics and Statistics, VI, University of California Press, pp. 443–463). In that study, 60 Anacapa pelican eggs were collected and measured for their shell thickness, in millimeters (mm), and concentration of PCBs, in parts per million (ppm). The data are on the WeissStats site. a. obtain and interpret the standard error of the estimate. b. obtain a residual plot and a normal probability plot of the residuals. c. decide whether you can reasonably consider Assumptions 1–3 for regression inferences met by the two…arrow_forwardIn an experiment to determine the effect of ambient temperature on the emissons of oxides of nitrogen ( NOx ) of diesel trucks, 10 trucks were run at temperatures of 40°F and 80°F . The emissions, in parts per billion, are presented in the following table. Truck 40°F 80°F 1 926.5 896.7 2 851.1 857.0 3 975.5 952.1 4 1009.3 884.8 5 871.8 840.7 6 949.2 885.1 7 1006.3 885.5 8 836.5 777.8 9 837.8 850.2 10 958.9 882.1 Send data to Excel Let μ1 represent the mean emission at 40°F and =μd−μ1μ2 .Can you conclude that the mean emission differs between the two temperatures? Use the =α0.05 level of significance and the TI-84 Plus calculator to answer the following. p value ? do we reject? is there enough evidence :?arrow_forwardConsider the following data on 20 chemical reactions, with Y = chromatographic retention time (seconds) and X = molecular weight (gm/mole). Retention Time and Molecular Weight (n = 20) Name RetentionTime Molecular Weight alpha-pinene 234.50 136.24 cyclopentene 95.27 68.12 p-diethyl benzene 284.00 134.22 decane 250.60 142.29 toluene 174.00 92.14 benzene 135.70 78.11 2-methyl pentane 97.24 86.18 2,3 dimethylbutane 100.70 86.18 1,7-octadiene 172.20 110.20 1,2,4-trimethyl benzene 262.70 120.19 2,3,4-trimethyl pentane 160.98 114.23 ethylcyclohexane 195.07 112.22 limonene 271.50 136.24 methyl cyclohexane 153.57 98.19 m-diethyl benzene 281.50 134.22 2,3-dimethyl pentane 131.83 100.20 2,2-dimethyl butane 89.34 86.18 pentane 78.00 72.15 isooctane 136.90 114.23 hexane 106.00 86.18…arrow_forward
- Here is a dataset containing plant growth measurements of plants grown in solutions of commonly-found chemicals in roadway runoff.Phragmites australis, a fast-growing non-native grass common to roadsides and disturbed wetlands of Tidewater Virginia, was grown in a greenhouse and watered with either: Distilled water (control); A weak petroleum solution (representing standard roadway runoff); Sodium chloride solution; Magnesium chloride solution; De-icing brine (50% sodium chloride and 50% magnesium chloride).Twenty grass preparations were used for each solution, and total growth (in cm) was recorded after watering every other day for 40 days.-Perform the correct statistical test to determine the p-value.-Report your answer rounded to four decimal places.-You should use formulas, functions, and the Data Analysis ToolPak in MS Excel to avoid additive rounding errors. Here are some useful functions: =t.test(array1,array2,tails,type) Produces a p-value for any…arrow_forwardDetermine the support reactions at A and B.arrow_forwardThe article “Effect of Varying Solids Concentration and Organic Loading on the Performance of Temperature Phased Anaerobic Digestion Process” (S. Vandenburgh and T. Ellis, Water Environment Research, 2002:142–148) discusses experiments to determine the effect of the solids concentration on the performance of treatment methods for wastewater sludge. In the first experiment, the concentration of solids (in g/L) was 43.94 ± 1.18. In the second experiment, which was independent of the first, the concentration was 48.66 ± 1.76. Estimate the difference in the concentration between the two experiments, and find the uncertainty in the estimate.arrow_forward
- The article “Withdrawal Strength of Threaded Nails” (D. Rammer, S. Winistorfer, and D. Bender, Journal of Structural Engineering 2001:442–449) describes an experiment comparing the ultimate withdrawal strengths (in N/mm) for several types of nails. For an annularly threaded nail with shank diameter 3.76 mm driven into spruce-pine-fir lumber, the ultimate withdrawal strength was modeled as lognormal with μ = 3.82 and σ = 0.219. For a helically threaded nail under the same conditions, the strength was modeled as lognormal with μ = 3.47 and σ = 0.272. a) What is the mean withdrawal strength for annularly threaded nails? b) What is the mean withdrawal strength for helically threaded nails? c) For which type of nail is it more probable that the withdrawal strength will be greater than 50 N/mm? d) What is the probability that a helically threaded nail will have a greater withdrawal strength than the median for annularly threaded nails? e) An experiment is performed in which withdrawal…arrow_forwardAn investigation was conducted into the dust content in the flue gases of two types of solid-fuel boilers. Thirteen boilers of type A and nine boilers of type B were used under identical fueling and extraction conditions. Over a similar period, the quantities of dust were deposited in similar traps inserted in each of the twenty-two flues. Presented below are the collected dust content (in grams) given the source broiler type. Type A 73.1 56.4 82.1 67.2 78.7 75.1 48.0 53.3 55.5 61.5 60.6 55.2 63.1 Type B 53.0 39.3 55.8 58.8 41.2 66.6 46.0 56.4 58.9 questions are in inserted imagearrow_forwardThe article in the ASCE Journal of Energy Engineering (1999, Vol. 125, pp.59-75) describes a study of the thermal inertia properties of autoclaved aerated concrete used as a building material. Five samples of the material were tested in a structure, and the average interior temperatures (°C) reported were as follows: 23.01, 22.22, 22.04, 22.62, and 22.59. Test that the average interior temperature is equal to 22.5°C using alpha (a) = 0.05. This problem is a test on what population parameter? What is the null and alternative hypothesis? What are the Significance level and type of test? What standardized test statistic will be used? What is the standard test statistic? What is the Statistical Decision? What is the statistical decision in the statement form?arrow_forward
 MATLAB: An Introduction with ApplicationsStatisticsISBN:9781119256830Author:Amos GilatPublisher:John Wiley & Sons Inc
 Probability and Statistics for Engineering and th...StatisticsISBN:9781305251809Author:Jay L. DevorePublisher:Cengage Learning
 Statistics for The Behavioral Sciences (MindTap C...StatisticsISBN:9781305504912Author:Frederick J Gravetter, Larry B. WallnauPublisher:Cengage Learning
 Elementary Statistics: Picturing the World (7th E...StatisticsISBN:9780134683416Author:Ron Larson, Betsy FarberPublisher:PEARSON
 The Basic Practice of StatisticsStatisticsISBN:9781319042578Author:David S. Moore, William I. Notz, Michael A. FlignerPublisher:W. H. Freeman
 Introduction to the Practice of StatisticsStatisticsISBN:9781319013387Author:David S. Moore, George P. McCabe, Bruce A. CraigPublisher:W. H. Freeman