
Statistics for Engineers and Scientists
4th Edition
ISBN: 9780073401331
Author: William Navidi Prof.
Publisher: McGraw-Hill Education
expand_more
expand_more
format_list_bulleted
Concept explainers
Videos
Textbook Question
Chapter 7.4, Problem 3E
To determine the effect of temperature on the yield of a certain chemical process, the process is run 24 times at various temperatures. The temperature (in °C) and the yield (expressed as a percentage of a theoretical maximum) for each run are given in the following table. The results are presented in the order in which they were run, from earliest to latest.
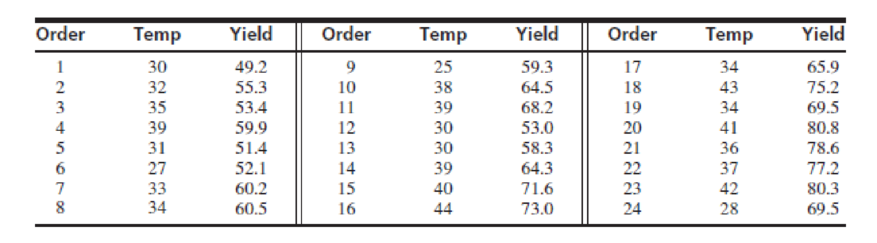
- a. Compute the least-squares line for predicting yield (y) from temperature (x).
- b. Plot the residuals versus the fitted values. Does the linear model seem appropriate? Explain.
- c. Plot the residuals versus the order in which the observations were made. Is there a trend in the residuals over time? Does the linear model seem appropriate? Explain.
Expert Solution & Answer
Want to see the full answer?
Check out a sample textbook solution
Students have asked these similar questions
Let x be the number of different research programs, and let y be the mean number of patents per program. As in any business, a company can spread itself too thin. For example, too many research programs might lead to a decline in overall research productivity. The following data are for a collection of pharmaceutical companies and their research programs.
x
10
12
14
16
18
20
y
1.7
1.6
1.6
1.4
1.0
0.7
(c) Find x, and y. Then find the equation of the least-squares line = a + bx. (Round your answers for x and y to two decimal places. Round your answers for a and b to three decimal places.)
x
=?
y
=?
=
?+ ?x
(f) Suppose a pharmaceutical company has 12 different research programs. What does the least-squares equation forecast for y = mean number of patents per program? (Round your answer to two decimal places.)
? patents per program
Table 14.17
The Least Squares Point Estimates for Exercise 14.51
Bo = 10.3676 (.3710)
B1 = .0500 (<.001)
B2 = 6.3218 (.0152)
B3 = -11.1032 (.0635)
B4 = -.4319 (.0002)
Questions
Using the t statistic and appropriate critical values, test Ho: βj = 0 versus Ha: βj ≠ 0 by setting α equal to .05. Which independent variables are significantly related to y in the model with α = .05?
Using the t statistic and appropriate critical values, test Ho: βj = 0 versus Ha: βj ≠ 0 by setting α equal to .01. Which independent variables are significantly related to y in the model with α = .01?
Find the p-value for testing Ho: βj = 0 versus Ha: βj ≠ 0 on the output. Using the p-value, determine whether we can reject Ho by setting α equal to .10, .05, .01, and .001. What do you conclude about the significance of the independent variables in the model?
Calculate the 95 percent confidence interval for βj. Discuss one practical application of this interval.
Calculate the 99 percent confidence interval for…
The following data pertain to the chlorine residual ina swimming pool at various times after it has been treatedwith chemicals:Number of Chlorine residualhours (parts per million)2 1.84 1.56 1.48 1.110 1.112 0.9
(a) Fit a least squares line from which we can predict thechlorine residual in terms of the number of hours sincethe pool has been treated with chemicals.(b) Use the equation of the least squares line to estimatethe chlorine residual in the pool five hours after it hasbeen treated with chemicals.
Chapter 7 Solutions
Statistics for Engineers and Scientists
Ch. 7.1 - Compute the correlation coefficient for the...Ch. 7.1 - For each of the following data sets, explain why...Ch. 7.1 - For each of the following scatterplots, state...Ch. 7.1 - True or false, and explain briefly: a. If the...Ch. 7.1 - In a study of ground motion caused by earthquakes,...Ch. 7.1 - A chemical engineer is studying the effect of...Ch. 7.1 - Another chemical engineer is studying the same...Ch. 7.1 - Tire pressure (in kPa) was measured for the right...Ch. 7.1 - Prob. 10ECh. 7.1 - The article Drift in Posturography Systems...
Ch. 7.1 - Prob. 12ECh. 7.1 - Prob. 13ECh. 7.1 - A scatterplot contains four points: (2, 2), (1,...Ch. 7.2 - Each month for several months, the average...Ch. 7.2 - In a study of the relationship between the Brinell...Ch. 7.2 - A least-squares line is fit to a set of points. If...Ch. 7.2 - Prob. 4ECh. 7.2 - In Galtons height data (Figure 7.1, in Section...Ch. 7.2 - In a study relating the degree of warping, in mm....Ch. 7.2 - Moisture content in percent by volume (x) and...Ch. 7.2 - The following table presents shear strengths (in...Ch. 7.2 - Structural engineers use wireless sensor networks...Ch. 7.2 - The article Effect of Environmental Factors on...Ch. 7.2 - An agricultural scientist planted alfalfa on...Ch. 7.2 - Curing times in days (x) and compressive strengths...Ch. 7.2 - Prob. 13ECh. 7.2 - An engineer wants to predict the value for y when...Ch. 7.2 - A simple random sample of 100 men aged 2534...Ch. 7.2 - Prob. 16ECh. 7.3 - A chemical reaction is run 12 times, and the...Ch. 7.3 - Structural engineers use wireless sensor networks...Ch. 7.3 - Prob. 3ECh. 7.3 - Prob. 4ECh. 7.3 - Prob. 5ECh. 7.3 - Prob. 6ECh. 7.3 - The coefficient of absorption (COA) for a clay...Ch. 7.3 - Prob. 8ECh. 7.3 - Prob. 9ECh. 7.3 - Three engineers are independently estimating the...Ch. 7.3 - In the skin permeability example (Example 7.17)...Ch. 7.3 - Prob. 12ECh. 7.3 - In a study of copper bars, the relationship...Ch. 7.3 - Prob. 14ECh. 7.3 - In the following MINITAB output, some of the...Ch. 7.3 - Prob. 16ECh. 7.3 - In order to increase the production of gas wells,...Ch. 7.4 - The following output (from MINITAB) is for the...Ch. 7.4 - The processing of raw coal involves washing, in...Ch. 7.4 - To determine the effect of temperature on the...Ch. 7.4 - The depth of wetting of a soil is the depth to...Ch. 7.4 - Good forecasting and control of preconstruction...Ch. 7.4 - The article Drift in Posturography Systems...Ch. 7.4 - Prob. 7ECh. 7.4 - Prob. 8ECh. 7.4 - A windmill is used to generate direct current....Ch. 7.4 - Two radon detectors were placed in different...Ch. 7.4 - Prob. 11ECh. 7.4 - The article The Selection of Yeast Strains for the...Ch. 7.4 - Prob. 13ECh. 7.4 - The article Characteristics and Trends of River...Ch. 7.4 - Prob. 15ECh. 7.4 - The article Mechanistic-Empirical Design of...Ch. 7.4 - An engineer wants to determine the spring constant...Ch. 7 - The BeerLambert law relates the absorbance A of a...Ch. 7 - Prob. 2SECh. 7 - Prob. 3SECh. 7 - Refer to Exercise 3. a. Plot the residuals versus...Ch. 7 - Prob. 5SECh. 7 - The article Experimental Measurement of Radiative...Ch. 7 - Prob. 7SECh. 7 - Prob. 8SECh. 7 - Prob. 9SECh. 7 - Prob. 10SECh. 7 - The article Estimating Population Abundance in...Ch. 7 - A materials scientist is experimenting with a new...Ch. 7 - Monitoring the yield of a particular chemical...Ch. 7 - Prob. 14SECh. 7 - Refer to Exercise 14. Someone wants to compute a...Ch. 7 - Prob. 16SECh. 7 - Prob. 17SECh. 7 - Prob. 18SECh. 7 - Prob. 19SECh. 7 - Use Equation (7.34) (page 545) to show that 1=1.Ch. 7 - Use Equation (7.35) (page 545) to show that 0=0.Ch. 7 - Prob. 22SECh. 7 - Use Equation (7.35) (page 545) to derive the...
Additional Math Textbook Solutions
Find more solutions based on key concepts
The manufacturer of a nationally distributed brand of potato chips wants to determine the feasibility of changi...
Basic Business Statistics, Student Value Edition (13th Edition)
A simple random sample of 200 third-graders in a large school district was chosen to participate in an after-sc...
Essential Statistics
Fill in the blank: The probability that a fair coin lands heads is 0.5. Therefore, we can be sure that if we to...
Elementary Statistics ( 3rd International Edition ) Isbn:9781260092561
AVX Home Entertainment, Inc., recently began a “no-hassles” return policy. A sample of 500 customers who recent...
EBK STATISTICAL TECHNIQUES IN BUSINESS
Find how many SDs above the mean price would be predicted to cost.
Intro Stats, Books a la Carte Edition (5th Edition)
In Exercises 9-20, use the data in the following table, which lists drive-thru order accuracy at popular fast f...
Essentials of Statistics (6th Edition)
Knowledge Booster


Learn more about
Need a deep-dive on the concept behind this application? Look no further. Learn more about this topic, statistics and related others by exploring similar questions and additional content below.Similar questions
- In a study measuring the relationship between height in centimeters and annual income in dollars, it has been determined that for Group 1, r2 =0.15 and for Group 2, r2 =0.10 where r denotes the correlation between the two variables. Least-squares regression lines are fitted to the observations from each group. Which of the following statement is true: A. There could be a positive relationship between the two variables for Group 1 and a negative relationship between the two variables for Group 2 B. The sum of the residuals for Group 1 is greater than the sum of the residuals for Group 2. C. Measuring the height in inches would increase the value of r2 for both groups. D. None of the answer options is true Can you also explain the difference between r and r2, and why least square regressions are used?arrow_forwardA security firm wants to renew the uniforms used by his personnel. It starts by collecting data on their height and weight. The following data was collected from the 19 employees Height (cm) Weight (kg) 168 72 175 88 167 84 171 87 161 67 164 55 177 82 170 60 167 60 184 77 183 98 163 53 186 77 165 64 173 89 161 65 179 77 169 64 174 87 a). Construct an equation to relate these variables, using the least-squares method to determine the regression coefficients, b0 and b1. b). Interpret the meaning of b0 and b1 in this problem. c) determine the coefficient of determination, r2 and interpret its meaning.arrow_forwardThe following table is an abbreviated life expectancy table for males. current age, x 0 20 40 60 80 life expectancy, y 76.6 years 78.9 years 80.5 years 81.7 years 82.7 years a. Find the straight line that provides the best least-squares fit for these data.arrow_forward
- The operations manager of a musical instrument distributor feels that demand for a particular type of guitar may be related to the number of YouTube views for a music video by the popular rock group Marble Pumpkins during the preceding month. The manager has collected the data shown in the following table: YouTube views (1,000s) Guitar Sales 30 8 40 11 70 12 60 10 80 15 50 13 a. Using the equations presented in this chapter, compute the SST, SSE, and SSR. Find the least-squares regression line for these data (use manual computations) b. Using the regression equation, predict guitar sales if there were 40,000 views last month (use manual computations)arrow_forward(g) Compute the sum of the squared residuals for the least-squares regression line found in part (d).arrow_forwardSuppose Wesley is a marine biologist who is interested in the relationship between the age and the size of male Dungeness crabs. Wesley collects data on 1,000 crabs and uses the data to develop the following least-squares regression line where ? is the age of the crab in months and ?̂ is the predicted value of ?, the size of the male crab in cm. ?̂=8.2052+0.5693? What is the value of ?̂ when a male crab is 21.7865 months old? Provide your answer with precision to two decimal placearrow_forward
- Suppose Wesley is a marine biologist who is interested in the relationship between the age and the size of male Dungeness crabs. Wesley collects data on 1,000 crabs and uses the data to develop the following least-squares regression line where ? is the age of the crab in months and ?ˆ is the predicted value of ?, the size of the male crab in cm. ?ˆ=8.1312+0.5226? What is the value of ?ˆ when a male crab is 23.0736 months old? Provide your answer with precision to two decimal places. ?ˆ = Interpret the value of ?. The value of ?ˆis the predicted size of a crab when it is 23.0736 months old. the predicted incremental increase in size for every increase in age by 23.0736 months. the predicted number of crabs out of the 1,000 crabs collected that will be 23.0736 months old. the probability that a crab will be 23.0736 months old.arrow_forwardConsider the following table containing unemployment rates for a 10-year period. Unemployment Rates Year Unemployment Rate (%) 1 5.85.8 2 3.23.2 3 5.55.5 4 8.68.6 5 6.16.1 6 6.86.8 7 7.57.5 8 5.25.2 9 11.111.1 10 7.47.4 Step 1 of 2 : Given the model Estimated Unemployment Rate=β0+β1(Year)+εi,Estimated Unemployment Rate=�0+�1(Year)+��, write the estimated regression equation using the least squares estimates for β0�0 and β1�1. Round your answers to two decimal places.arrow_forward
arrow_back_ios
arrow_forward_ios
Recommended textbooks for you
 Linear Algebra: A Modern IntroductionAlgebraISBN:9781285463247Author:David PoolePublisher:Cengage Learning
 Elementary Linear Algebra (MindTap Course List)AlgebraISBN:9781305658004Author:Ron LarsonPublisher:Cengage Learning
Linear Algebra: A Modern Introduction
Algebra
ISBN:9781285463247
Author:David Poole
Publisher:Cengage Learning
Elementary Linear Algebra (MindTap Course List)
Algebra
ISBN:9781305658004
Author:Ron Larson
Publisher:Cengage Learning
The Shape of Data: Distributions: Crash Course Statistics #7; Author: CrashCourse;https://www.youtube.com/watch?v=bPFNxD3Yg6U;License: Standard YouTube License, CC-BY
Shape, Center, and Spread - Module 20.2 (Part 1); Author: Mrmathblog;https://www.youtube.com/watch?v=COaid7O_Gag;License: Standard YouTube License, CC-BY
Shape, Center and Spread; Author: Emily Murdock;https://www.youtube.com/watch?v=_YyW0DSCzpM;License: Standard Youtube License