
Videos
Hypothesis Testing Using Rejection Region(s) In Exercises 37–42, (a) identify the claim and state H0 and Ha, (b) find the critical value(s) and identify the rejection region(s), (c) find the standardized test statistic z, (d) decide whether to reject or fail to reject the null hypothesis, and (e) interpret the decision in the context of the original claim.
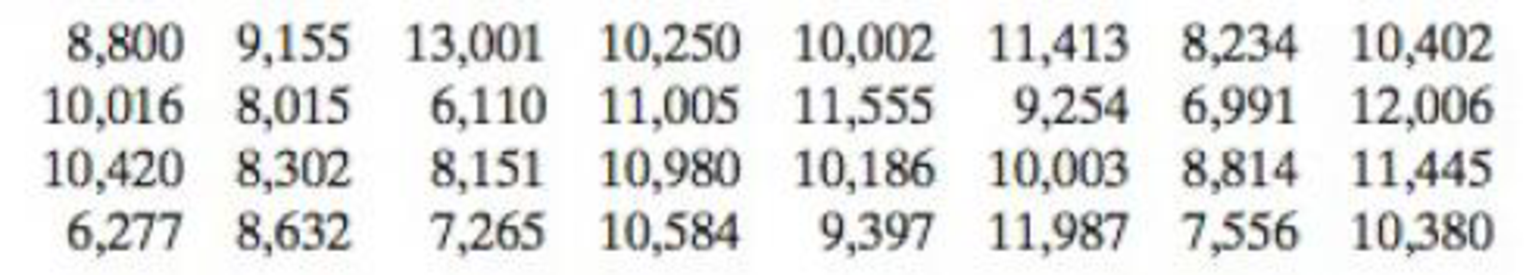
 41. Fluorescent Lamps A fluorescent lamp manufacturer guarantees that the mean life of a fluorescent lamp is at least 10,000 hours. You want to test this guarantee. To do so, you record the lives of a random sample of 32 fluorescent lamps. The results (in hours) are listed. Assume the population standard deviation is 1850 hours. At α = 0.11, do you have enough evidence to reject the manufacturer’s claim?
Want to see the full answer?
Check out a sample textbook solution
Chapter 7 Solutions
Elementary Statistics: Picturing the World (7th Edition)


- Testing Claims About Variation. In Exercises 5–16, test the given claim. Identify the null hypothesis, alternative hypothesis, test statistic, P-value, or critical value(s), then state the conclusion about the null hypothesis, as well as the final conclusion that addresses the original claim. Assume that a simple random sample is selected from a normally distributed population. Coffee Vending Machines The Brazil vending machine dispenses coffee, and a random sample of 27 filled cups have contents with a mean of 7.14 oz and a standard deviation of 0.17 oz. Use a 0.05 significance level to test the claim that the machine dispenses amounts with a standard deviation greater than the standard deviation of 0.15 oz specified in the machine design.arrow_forwardTesting Claims About Variation. In Exercises 5–16, test the given claim. Identify the null hypothesis, alternative hypothesis, test statistic, P-value, or critical value(s), then state the conclusion about the null hypothesis, as well as the final conclusion that addresses the original claim. Assume that a simple random sample is selected from a normally distributed population. Bank Lines The Jefferson Valley Bank once had a separate customer waiting line at each teller window, but it now has a single waiting line that feeds the teller windows as vacancies occur. The standard deviation of customer waiting times with the old multiple-line configuration was 1.8 min. Listed below is a simple random sample of waiting times (minutes) with the single waiting line. Use a 0.05 significance level to test the claim that with a single waiting line, the waiting times have a standard deviation less than 1.8 min. What improvement occurred when banks changed from multiple waiting lines to a single…arrow_forwardTesting Hypotheses. In Exercises 13–24, assume that a simple random sample has been selected and test the given claim. Unless specified by your instructor, use either the P-value method or the critical value method for testing hypotheses. Identify the null and alternative hypotheses, test statistic, P-value (or range of P-values), or critical value(s), and state the final conclusion that addresses the original claim. Lead in Medicine Listed below are the lead concentrations (in μ g/g) measured in different Ayurveda medicines. Ayurveda is a traditional medical system commonly used in India. The lead concentrations listed here are from medicines manufactured in the United States (based on data from “Lead, Mercury, and Arsenic in US and Indian Manufactured Ayurvedic Medicines Sold via the Internet,” by Saper et al., Journal of the American Medical Association, Vol. 300, No. 8). Use a 0.05 significance level to test the claim that the mean lead concentration for all such medicines is…arrow_forward
- Testing Claims About Variation. In Exercises 5–16, test the given claim. Identify the null hypothesis, alternative hypothesis, test statistic, P-value, or critical value(s), then state the conclusion about the null hypothesis, as well as the final conclusion that addresses the original claim. Assume that a simple random sample is selected from a normally distributed population. Statistics Test Scores Tests in the author’s statistics classes have scores with a standard deviation equal to 14.1. One of his last classes had 27 test scores with a standard deviation of 9.3. Use a 0.01 significance level to test the claim that this class has less variation than other past classes. Does a lower standard deviation suggest that this last class is doing better?arrow_forwardTesting Hypotheses. In Exercises 13–24, assume that a simple random sample has been selected and test the given claim. Unless specified by your instructor, use either the P-value method or the critical value method for testing hypotheses. Identify the null and alternative hypotheses, test statistic, P-value (or range of P-values), or critical value(s), and state the final conclusion that addresses the original claim. Got a Minute? Students of the author estimated the length of one minute without reference to a watch or clock, and the times (seconds) are listed below. Use a 0.05 significance level to test the claim that these times are from a population with a mean equal to 60 seconds. Does it appear that students are reasonably good at estimating one minute?arrow_forwardTesting Claims About Proportions. In Exercises 7–22, test the given claim. Identify the null hypothesis, alternative hypothesis, test statistic, P-value or critical value(s), then state the conclusion about the null hypothesis, as well as the final conclusion that addresses the original claim. Ground vs. Helicopter for Serious Injuries A study investigated rates of fatalities among patients with serious traumatic injuries. Among 61,909 patients transported by helicopter, 7813 died. Among 161,566 patients transported by ground services, 17,775 died (based on data from “Association Between Helicopter vs Ground Emergency Medical Services and Survival for Adults With Major Trauma,” by Galvagno et al., Journal of the American Medical Association , Vol. 307, No. 15). Use a 0.01 significance level to test the claim that the rate of fatalities is higher for patients transported by helicopter. a. Test the claim using a hypothesis test. b. Test the claim by constructing an appropriate…arrow_forward
- Testing Claims About Variation. In Exercises 5–16, test the given claim. Identify the null hypothesis, alternative hypothesis, test statistic, P-value, or critical value(s), then state the conclusion about the null hypothesis, as well as the final conclusion that addresses the original claim. Assume that a simple random sample is selected from a normally distributed population. Spoken Words Couples were recruited for a study of how many words people speak in a day. A random sample of 56 males resulted in a mean of 16,576 words and a standard deviation of 7871 words. Use a 0.01 significance level to test the claim that males have a standard deviation that is greater than the standard deviation of 7460 words for females (based on Data Set 24 “Word Counts”).arrow_forwardTesting Claims About Proportions. In Exercises 7–22, test the given claim. Identify the null hypothesis, alternative hypothesis, test statistic, P-value or critical value(s), then state the conclusion about the null hypothesis, as well as the final conclusion that addresses the original claim. Denomination Effect A trial was conducted with 75 women in China given a 100-yuan bill, while another 75 women in China were given 100 yuan in the form of smaller bills (a 50-yuan bill plus two 20-yuan bills plus two 5-yuan bills). Among those given the single bill, 60 spent some or all of the money. Among those given the smaller bills, 68 spent some or all of the money (based on data from “The Denomination Effect,” by Raghubir and Srivastava, Journal of Consumer Research, Vol. 36). We want to use a 0.05 significance level to test the claim that when given a single large bill, a smaller proportion of women in China spend some or all of the money when compared to the proportion of women in China…arrow_forwardTesting Claims About Variation. In Exercises 5–16, test the given claim. Identify the null hypothesis, alternative hypothesis, test statistic, P-value, or critical value(s), then state the conclusion about the null hypothesis, as well as the final conclusion that addresses the original claim. Assume that a simple random sample is selected from a normally distributed population. Aircraft Altimeters The Skytek Avionics company uses a new production method to manufacture aircraft altimeters. A simple random sample of new altimeters resulted in the errors listed below. Use a 0.05 level of significance to test the claim that the new production method has errors with a standard deviation greater than 32.2 ft, which was the standard deviation for the old production method. If it appears that the standard deviation is greater, does the new production method appear to be better or worse than the old method? Should the company take any action?arrow_forward
- Testing Claims About Proportions. In Exercises 7–22, test the given claim. Identify the null hypothesis, alternative hypothesis, test statistic, P-value or critical value(s), then state the conclusion about the null hypothesis, as well as the final conclusion that addresses the original claim. Lefties In a random sample of males, it was found that 23 write with their left hands and 217 do not. In a random sample of females, it was found that 65 write with their left hands and 455 do not (based on data from “The Left-Handed: Their Sinister History,” by Elaine Fowler Costas, Education Resources Information Center, Paper 399519). We want to use a 0.01 significance level to test the claim that the rate of left-handedness among males is less than that among females. a. Test the claim using a hypothesis test. b. Test the claim by constructing an appropriate confidence interval. c. Based on the results, is the rate of left-handedness among males less than the rate of left-handedness among…arrow_forwardTesting Claims About Variation. In Exercises 5–16, test the given claim. Identify the null hypothesis, alternative hypothesis, test statistic, P-value, or critical value(s), then state the conclusion about the null hypothesis, as well as the final conclusion that addresses the original claim. Assume that a simple random sample is selected from a normally distributed population. Cola Cans A random sample of 20 aluminum cola cans with thickness 0.0109 in. is selected and the axial loads are measured and the standard deviation is 18.6 lb. The axial load is the pressure applied to the top that causes the can to crush. Use a 0.05 significance level to test the claim that cans with thickness 0.0109 in. have axial loads with the same standard deviation as the axial loads of cans that are 0.0111 in. thick. The thicker cans have axial loads with a standard deviation of 27.8 lb (based on Data Set 30 “Aluminum Cans” in Appendix B). Does the thickness of the cans appear to affect the variation of…arrow_forwardTesting Claims About Proportions. In Exercises 7–22, test the given claim. Identify the null hypothesis, alternative hypothesis, test statistic, P-value or critical value(s), then state the conclusion about the null hypothesis, as well as the final conclusion that addresses the original claim. License Plate Laws The Chapter Problem involved passenger cars in Connecticut and passenger cars in New York, but here we consider passenger cars and commercial trucks. Among 2049 Connecticut passenger cars, 239 had only rear license plates. Among 334 Connecticut trucks, 45 had only rear license plates (based on samples collected by the author). A reasonable hypothesis is that passenger car owners violate license plate laws at a higher rate than owners of commercial trucks. Use a 0.05 significance level to test that hypothesis. a. Test the claim using a hypothesis test. b. Test the claim by constructing an appropriate confidence interval.arrow_forward
 MATLAB: An Introduction with ApplicationsStatisticsISBN:9781119256830Author:Amos GilatPublisher:John Wiley & Sons Inc
 Probability and Statistics for Engineering and th...StatisticsISBN:9781305251809Author:Jay L. DevorePublisher:Cengage Learning
 Statistics for The Behavioral Sciences (MindTap C...StatisticsISBN:9781305504912Author:Frederick J Gravetter, Larry B. WallnauPublisher:Cengage Learning
 Elementary Statistics: Picturing the World (7th E...StatisticsISBN:9780134683416Author:Ron Larson, Betsy FarberPublisher:PEARSON
 The Basic Practice of StatisticsStatisticsISBN:9781319042578Author:David S. Moore, William I. Notz, Michael A. FlignerPublisher:W. H. Freeman
 Introduction to the Practice of StatisticsStatisticsISBN:9781319013387Author:David S. Moore, George P. McCabe, Bruce A. CraigPublisher:W. H. Freeman