
SURVEY OF ACCOUNTING 360DAY CONNECT CAR
5th Edition
ISBN: 9781260591811
Author: Edmonds
Publisher: MCG
expand_more
expand_more
format_list_bulleted
Videos
Textbook Question
Chapter 9, Problem 21P
Problem 9-21 Ratio analysis
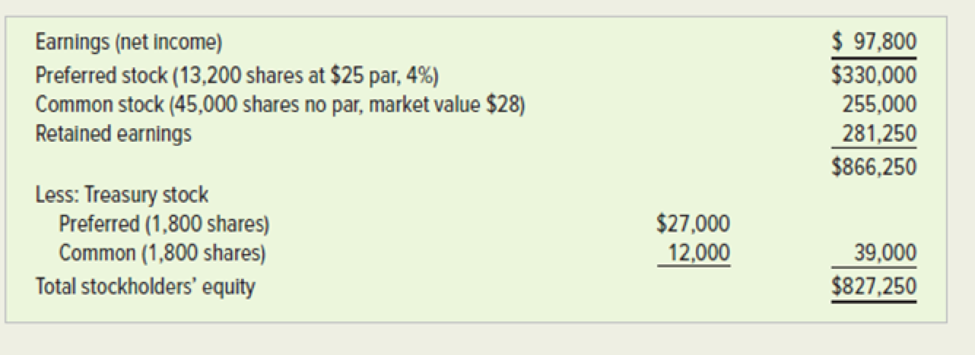
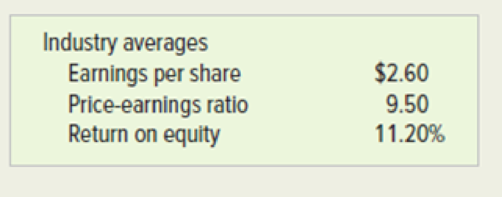
Selected data for Dalton Company for 2018 and additional information on industry averages follow:
Required
- a. Calculate and compare Dalton Company’s ratios with the industry averages.
- b. Discuss factors you would consider in deciding whether to invest in the company.
Expert Solution & Answer
Want to see the full answer?
Check out a sample textbook solution
Students have asked these similar questions
Problem 13-2A (Static) Ratios, common-size statements, and trend percents LO P1, P2, P3
Skip to question
[The following information applies to the questions displayed below.]Selected comparative financial statements of Korbin Company follow.
KORBIN COMPANY
Comparative Income Statements
For Years Ended December 31
2021
2020
2019
Sales
$ 555,000
$ 340,000
$ 278,000
Cost of goods sold
283,500
212,500
153,900
Gross profit
271,500
127,500
124,100
Selling expenses
102,900
46,920
50,800
Administrative expenses
50,668
29,920
22,800
Total expenses
153,568
76,840
73,600
Income before taxes
117,932
50,660
50,500
Income tax expense
40,800
10,370
15,670
Net income
$ 77,132
$ 40,290
$ 34,830
KORBIN COMPANY
Comparative Balance Sheets
December 31
2021
2020
2019
Assets
Current assets
$ 52,390
$ 37,924
$ 51,748
Long-term investments
0
500
3,950
Plant assets, net
100,000
96,000
60,000
Total assets
$ 152,390
$ 134,424
$ 115,698
Liabilities…
Problem 17-2A Ratios, common-size statements, and trend percents LO P1, P2, P3
Skip to question
[The following information applies to the questions displayed below.] Selected comparative financial statements of Korbin Company follow.
KORBIN COMPANY
Comparative Income Statements
For Years Ended December 31, 2019, 2018, and 2017
2019
2018
2017
Sales
$
459,716
$
352,180
$
244,400
Cost of goods sold
276,749
223,282
156,416
Gross profit
182,967
128,898
87,984
Selling expenses
65,280
48,601
32,261
Administrative expenses
41,374
30,992
20,285
Total expenses
106,654
79,593
52,546
Income before taxes
76,313
49,305
35,438
Income tax expense
14,194
10,108
7,194
Net income
$
62,119
$
39,197
$
28,244
KORBIN COMPANY
Comparative Balance Sheets
December 31, 2019, 2018, and 2017
2019
2018
2017
Assets
Current assets
$
58,718
$
39,300…
xercise 12-80Asset Efficiency Ratios
Financial statements for Steele Inc. follow.
Steele Inc.
Consolidated Income Statements
(in thousands except per share amounts)
2019
2018
2017
Net sales
$7,245,088
$6,944,296
$6,149,218
Cost of goods sold
(5,286,253)
(4,953,556)
(4,355,675)
Gross margin
$1,958,835
$1,990,740
$1,793,543
General and administrative expenses
(1,259,896)
(1,202,042)
(1,080,843)
Special and nonrecurring items
2,617
0
0
Operating income
$701,556
$788,698
$712,700
Interest expense
(63,685)
(62,398)
(63,927)
Other income
7,308
10,080
11,529
Gain on sale of investments
0
9,117
0
Income before income taxes
$645,179
$745,497
$660,302
Provision for income taxes
(254,000)
(290,000)
(257,000)
Net income
$391,179
$455,497
$403,302
Steele Inc.
Consolidated Balance Sheets
(in thousands)
ASSETS
Dec. 31, 2019
Dec. 31, 2018
Current assets:
Cash and equivalents…
Chapter 9 Solutions
SURVEY OF ACCOUNTING 360DAY CONNECT CAR
Ch. 9 - 1. Why are ratios and trends used in financial...Ch. 9 - Prob. 2QCh. 9 - Prob. 3QCh. 9 - 4. What is the significance of inventory turnover,...Ch. 9 - 5. What is the difference between the current...Ch. 9 - Prob. 6QCh. 9 - Prob. 7QCh. 9 - Prob. 8QCh. 9 - 9. What are some limitations of the earnings per...Ch. 9 - Prob. 10Q
Ch. 9 - Prob. 11QCh. 9 - Prob. 12QCh. 9 - Prob. 13QCh. 9 - Prob. 14QCh. 9 - Exercise 9-1 Horizontal analysis Winthrop...Ch. 9 - Prob. 2ECh. 9 - Prob. 3ECh. 9 - Prob. 4ECh. 9 - Prob. 5ECh. 9 - Prob. 6ECh. 9 - Prob. 7ECh. 9 - Prob. 8ECh. 9 - Comprehensive analysis The December 31, 2019,...Ch. 9 - Prob. 10ECh. 9 - Prob. 11ECh. 9 - Prob. 12ECh. 9 - Ratio analysis Compute the specified ratios using...Ch. 9 - Prob. 14ECh. 9 - LO 13-2, 13-3, 13-4, 13-5 Exercise 13-15A...Ch. 9 - Prob. 16PCh. 9 - Prob. 17PCh. 9 - Prob. 18PCh. 9 - Prob. 19PCh. 9 - Prob. 20PCh. 9 - Problem 9-21 Ratio analysis Selected data for...Ch. 9 - Prob. 22PCh. 9 - Problem 9-23 Ratio analysis The following...Ch. 9 - Prob. 24PCh. 9 - Prob. 1ATCCh. 9 - Prob. 3ATCCh. 9 - ATC 9-5 Ethical Dilemma Making the ratios look...
Knowledge Booster


Learn more about
Need a deep-dive on the concept behind this application? Look no further. Learn more about this topic, accounting and related others by exploring similar questions and additional content below.Similar questions
- RATIO ANALYSIS Data for Barry Computer Co. and its industry averages follow. a. Calculate the indicated ratios for Barry. b. Construct the DuPont equation for both Barry and the industry. c. Outline Barrys strengths and weaknesses as revealed by your analysis. d. Suppose Barry had doubled its sales as well as its inventories, accounts receivable, and common equity during 2016. How would that information affect the validity of your ratio analysis? (Hint: Think about averages and the effects of rapid growth on ratios if averages are not used. No calculations are needed.) Ratio Barry Industry Average Current ----- 2.0 Quick ----- 13 Days sales outstandinga ----- 35 days Inventory turnover ----- 6.7 Total assets turnover ----- 3.0 Profit margin ----- 1.2% ROA ------ 3.6% ROE ----- 9.0% ROIC ----- 73% TIE ----- 3.0 Debt/Total capital ----- 47.0% aCalculation is based on a 365-day year.arrow_forwardSales transactions Using transactions listed in P4-2, indicate the effects of each transaction on the liquidity metric working capital and profitability metric gross profit percent. Indicate the gross profit percent for each sale (rounding to one decimal place) in parentheses next to the effect of the sale on the company’s ability to attain an overall gross profit percent of 30%.arrow_forwardRATIO ANALYSIS Data for Barry Computer Co. and its industry averages follow. a. Calculate the indicated ratios for Barry. b. Construct the DuPont equation for both Barry and the industry. c. Outline Barrys strengths and weaknesses as revealed by your analysis. d. Suppose Barry had doubled its sales as well as its inventories, accounts receivable, and common equity during 2015. How would that information affect the validity of your ratio analysis? (Hint: Think about averages and the effects of rapid growth on ratios if averages are not used. No calculations are needed.) Barry Computer Company: Balance Sheet as of December 31, 2015 (in Thousands) Cash 77,500 Accounts payable 129,000 Receivables 336,000 Other current liabilities 117,000 Inventories 241,500 Notes payable to bank 84,000 Total current assets 655,000 Total current liabilities 330,000 Long-term debt 256,500 Net fixed assets 292,500 Common equity 361,000 Total assets 947,500 Total liabilities and equity 947,500 Barry Computer Company: Income Statement for Year Ended December 31, 2015 (in Thousands) Sales 1,607,500 Cost of goods sold Materials 717,000 Labor 453,000 Heat, light, and power 68,000 Indirect labor 113,000 Depreciation 41,500 1,392,500 Gross profit 215,000 Selling expenses 115,000 General and administrative expenses 30,000 Earnings before interest and taxes (EBIT) 70,000 Interest expense 24,500 Earnings before taxes (EBT) 45,500 Federal and state income taxes (40%) 18,200 Net income 27,300 Ratio Barry Industry Average Current _____ 2.0 Quick _____ 1.3 Days sales outstandinga _____ 35 days Inventory turnover _____ 6.7 aCalculation is based on a 365-day year Total assets turnover _____ 3.0 Profit margin _____ 1.20% ROA _____ 0 ROE _____ 9.00% ROIC _____ 0 TIE _____ 3.0 Debt/Total capital _____ 47.00%arrow_forward
- Instructions: I. Resolve the ratios listed on table a for each year (2020 & 2021): a. For each ratio includes the formula with math computes (2020 & 2021) b. . Fill M&G Industries Ratio Analysis Table A. (2020 & 2021) II. Perform the following Analysis: a. Explain each ratio results for 2021 only. b. Compare each ratio performance with the previous year results (compare 2021 results with 2020 results) c. Compare each Ratio results for 2021 with their respective Industry average. III. Base on the previous results, evaluate and explain the Company financial position using the following questions: 1. How liquid is the firm? 2. Is management generating adequate operating profits on the firm’s assets? 3. How is the firm financing its assets? 4. Are the owners (stockholders) receiving an adequate return on their investment?arrow_forwardQuestion 6 Anita Limited has shared their annual sales revenue over the last 6 financial years from 2015 to 2020. Year Sales ($ 000) 2015 4500 2016 5100 2017 4900 2018 5400 2019 5670 2020 6000 You are required to; Using linear trend equation forecast the sales revenue of Anita Limited for 2021. ANSWER: Calculate the forecasted sales difference if you use 3-period weighted moving average designed with the following weights: 2018 (0.1), 2019 (0.3) and 2020(0.6).arrow_forwardAssignment 1 : Select a company. It is advised to choose the organization ( if it is listed ) where you are employed for this assignment. If your organization is not listed you may choose any other listed company from your industry or related industry. · Download last 3 years annual report. · Compute the financial ratios for last 3 years and see the trend [ Profitability ratios, Liquidity ratios, Activity Ratios, Financing Ratios, and Market Ratios ] . You need to do this exercise on an excel file. · Provide explanation on the strategic implications of these ratios on your company ’ s financial standing and strategy. You may explain in 2 - 3 lines for each category of ratios. [ Profitability ratios, Liquidity ratios, Activity Ratios, Financing Ratios, and Market Ratios ] . Use the same company as the one mentioned in Assignment 1 . • Part A: Strategic Analysis • Conduct a strategic analysis using PESTLE and Porter ’ s 5 forces tools for understanding the…arrow_forward
- Problem 17-5A Comparative ratio analysis LO P3 Skip to question [The following information applies to the questions displayed below.] Summary information from the financial statements of two companies competing in the same industry follows. BarcoCompany KyanCompany BarcoCompany KyanCompany Data from the current year-end balance sheets Data from the current year’s income statement Assets Sales $ 770,000 $ 897,200 Cash $ 19,000 $ 30,000 Cost of goods sold 594,100 642,500 Accounts receivable, net 34,400 57,400 Interest expense 8,100 18,000 Merchandise inventory 84,740 140,500 Income tax expense 14,800 24,769 Prepaid expenses 5,900 7,150 Net income 153,000 211,931 Plant assets, net 310,000 305,400 Basic earnings per share 4.50 5.41 Total assets $ 454,040 $ 540,450 Cash dividends per share 3.82 3.93 Liabilities and Equity…arrow_forwardQuestion 8: You are provided with the Income Statement and the Balance Sheet of HTS software, Inc. for 2011. Required: (a) Calculate the ratios stated in the table below for HTS Software, Inc. for 2011 (b) Analyze the current financial position for the company from a time series and cross section viewpoint. (c) Break your analysis into an evaluation of the firm’s liquidity, activity, debt, profitability and market ratios. Historical and Industry Average Ratios HTS Software , Inc. Ratio 2010 2011 Industry2011 Current Ratio 2.6 — 2.7 Quick Ratio 1.8 — 1.75 Inventory Turnover 4.5 — 4.7 Average Collection Period 40days — 42 days Total Asset Turnover 1.2 — 1 Debt Ratio 20% — 21% Times Interest Earned 9 — 8.9 Gross Profit Margin 43% — 44% Operating Profit Margin 30% — 32% Net Profit Margin 20% — 21% Return on total assets 12% — 13% Return on Equity…arrow_forwarda) Prepare a projected income statement for the year to 31 October Year 8. b) Calculate for Year 7 and Year 8 i) Earnings per Share ii) Degree of operating gearing iii) Degree of financial gearing iv) Degree of combined gearing c) Briefly evaluate the information produced in a & b d) Calculate the sales revenue required in Year 8 to maintain existing earnings per sharearrow_forward
- Problem 17-5A Comparative ratio analysis LO P3 Skip to question [The following information applies to the questions displayed below.] Summary information from the financial statements of two companies competing in the same industry follows. BarcoCompany KyanCompany BarcoCompany KyanCompany Data from the current year-end balance sheets Data from the current year’s income statement Assets Sales $ 770,000 $ 882,200 Cash $ 19,000 $ 37,000 Cost of goods sold 593,100 638,500 Accounts receivable, net 36,400 58,400 Interest expense 7,800 18,000 Merchandise inventory 84,440 130,500 Income tax expense 14,800 24,355 Prepaid expenses 5,500 7,150 Net income 154,300 201,345 Plant assets, net 370,000 312,400 Basic earnings per share 4.06 4.09 Total assets $ 515,340 $ 545,450 Cash dividends per share 3.78 3.94 Liabilities and Equity…arrow_forwardProblem 17-5A Comparative ratio analysis LO P3 Skip to question [The following information applies to the questions displayed below.] Summary information from the financial statements of two companies competing in the same industry follows. BarcoCompany KyanCompany BarcoCompany KyanCompany Data from the current year-end balance sheets Data from the current year’s income statement Assets Sales $ 770,000 $ 882,200 Cash $ 19,000 $ 37,000 Cost of goods sold 593,100 638,500 Accounts receivable, net 36,400 58,400 Interest expense 7,800 18,000 Merchandise inventory 84,440 130,500 Income tax expense 14,800 24,355 Prepaid expenses 5,500 7,150 Net income 154,300 201,345 Plant assets, net 370,000 312,400 Basic earnings per share 4.06 4.09 Total assets $ 515,340 $ 545,450 Cash dividends per share 3.78 3.94 Liabilities and Equity…arrow_forwardExercise 23-11 Condensed financial data of Ivanhoe Company for 2020 and 2019 are presented below. IVANHOE COMPANYCOMPARATIVE BALANCE SHEETAS OF DECEMBER 31, 2020 AND 2019 2020 2019 Cash $1,770 $1,170 Receivables 1,780 1,300 Inventory 1,570 1,880 Plant assets 1,870 1,710 Accumulated depreciation (1,210 ) (1,190 ) Long-term investments (held-to-maturity) 1,290 1,430 $7,070 $6,300 Accounts payable $1,200 $900 Accrued liabilities 200 250 Bonds payable 1,430 1,580 Common stock 1,860 1,730 Retained earnings 2,380 1,840 $7,070 $6,300 IVANHOE COMPANYINCOME STATEMENTFOR THE YEAR ENDED DECEMBER 31, 2020 Sales revenue $6,820 Cost of goods sold 4,640 Gross margin 2,180 Selling and administrative expenses 910 Income…arrow_forward
arrow_back_ios
SEE MORE QUESTIONS
arrow_forward_ios
Recommended textbooks for you
 Cornerstones of Financial AccountingAccountingISBN:9781337690881Author:Jay Rich, Jeff JonesPublisher:Cengage Learning
 Survey of Accounting (Accounting I)AccountingISBN:9781305961883Author:Carl WarrenPublisher:Cengage Learning
 Fundamentals of Financial Management, Concise Edi...FinanceISBN:9781305635937Author:Eugene F. Brigham, Joel F. HoustonPublisher:Cengage Learning
 Fundamentals of Financial Management (MindTap Cou...FinanceISBN:9781285867977Author:Eugene F. Brigham, Joel F. HoustonPublisher:Cengage Learning
 Fundamentals of Financial Management, Concise Edi...FinanceISBN:9781285065137Author:Eugene F. Brigham, Joel F. HoustonPublisher:Cengage Learning
Cornerstones of Financial Accounting
Accounting
ISBN:9781337690881
Author:Jay Rich, Jeff Jones
Publisher:Cengage Learning
Survey of Accounting (Accounting I)
Accounting
ISBN:9781305961883
Author:Carl Warren
Publisher:Cengage Learning
Fundamentals of Financial Management, Concise Edi...
Finance
ISBN:9781305635937
Author:Eugene F. Brigham, Joel F. Houston
Publisher:Cengage Learning
Fundamentals of Financial Management (MindTap Cou...
Finance
ISBN:9781285867977
Author:Eugene F. Brigham, Joel F. Houston
Publisher:Cengage Learning
Fundamentals of Financial Management, Concise Edi...
Finance
ISBN:9781285065137
Author:Eugene F. Brigham, Joel F. Houston
Publisher:Cengage Learning
Financial Projections for Startups Basic Walkthrough; Author: Mike Lingle;https://www.youtube.com/watch?v=7avegQF4dxI;License: Standard youtube license